Verizon Wireless 2006 Annual Report Download - page 78
Download and view the complete annual report
Please find page 78 of the 2006 Verizon Wireless annual report below. You can navigate through the pages in the report by either clicking on the pages listed below, or by using the keyword search tool below to find specific information within the annual report.-
 1
1 -
2
-
3
-
4
-
5
-
6
-
7
-
8
-
9
-
10
-
11
-
12
-
13
-
14
-
15
-
16
-
17
-
18
-
19
-
20
-
21
-
22
-
23
-
24
-
25
-
26
-
27
-
28
-
29
-
30
-
31
-
32
-
33
-
34
-
35
-
36
-
37
-
38
-
39
-
40
-
41
-
42
-
43
-
44
-
45
-
46
-
47
-
48
-
49
-
50
-
51
-
52
-
53
-
54
-
55
-
56
-
57
-
58
-
59
-
60
-
61
-
62
-
63
-
64
-
65
-
66
-
67
-
 68
68 -
 69
69 -
 70
70 -
 71
71 -
 72
72 -
 73
73 -
 74
74 -
 75
75 -
 76
76 -
 77
77 -
 78
78 -
 79
79 -
 80
80 -
 81
81 -
 82
82 -
 83
83 -
 84
84
 |
 |

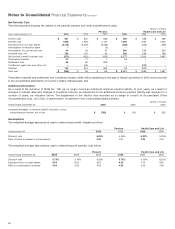
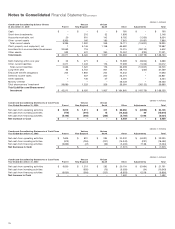
(dollars in millions)
Condensed Consolidating Balance Sheets Verizon Verizon
At December 31, 2005 Parent New England South Other Adjustments Total
Cash $ – $ – $ – $ 760 $ – $ 760
Short-term investments – 216 32 1,898 – 2,146
Accounts receivable, net 20 910 142 8,792 (1,330) 8,534
Other current assets 9,365 166 185 7,661 (9,497) 7,880
Total current assets 9,385 1,292 359 19,111 (10,827) 19,320
Plant, property and equipment, net 1 6,146 1,158 65,682 – 72,987
Investments in unconsolidated businesses 32,593 116 – 10,015 (38,122) 4,602
Other assets 532 472 390 70,057 (230) 71,221
Total Assets $42,511 $ 8,026 $ 1,907 $ 164,865 $ (49,179) $ 168,130
Debt maturing within one year $ 22 $ 471 $ – $ 15,999 $ (9,804) $ 6,688
Other current liabilities 2,511 1,049 176 17,299 (1,023) 20,012
Total current liabilities 2,533 1,520 176 33,298 (10,827) 26,700
Long-term debt 92 2,702 901 28,104 (230) 31,569
Employee benefit obligations 205 1,892 254 15,342 – 17,693
Deferred income taxes – 537 220 22,074 – 22,831
Other liabilities 1 146 27 3,050 – 3,224
Minority interest – – – 26,433 – 26,433
Total shareowners’ investment 39,680 1,229 329 36,564 (38,122) 39,680
Total Liabilities and Shareowners’
Investment $42,511 $ 8,026 $ 1,907 $ 164,865 $ (49,179) $ 168,130
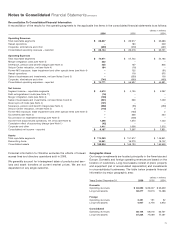
(dollars in millions)
Condensed Consolidating Statements of Cash Flows Verizon Verizon
Year Ended December 31, 2006 Parent New England South Other Adjustments Total
Net cash from operating activities $5,919 $ 1,211 $ 311 $ 22,260 $ (5,595) $ 24,106
Net cash from investing activities (779) (919) 15 (14,032) 99 (15,616)
Net cash from financing activities (5,140) (292) (326) (5,769) 5,496 (6,031)
Net Increase in Cash $ – $ – $ – $ 2,459 $ – $ 2,459
(dollars in millions)
Condensed Consolidating Statements of Cash Flows Verizon Verizon
Year Ended December 31, 2005 Parent New England South Other Adjustments Total
Net cash from operating activities $ 7,605 $ 831 $ 284 $ 20,242 $ (6,937) $ 22,025
Net cash from investing activities (913) (784) (221) (16,343) (231) (18,492)
Net cash from financing activities (6,692) (47) (63) (5,400) 7,168 (5,034)
Net Decrease in Cash $– $– $– $(1,501) $ – $ (1,501)
(dollars in millions)
Condensed Consolidating Statements of Cash Flows Verizon Verizon
Year Ended December 31, 2004 Parent New England South Other Adjustments Total
Net cash from operating activities $ 6,650 $ 1,219 $ 282 $ 20,104 $ (6,464) $ 21,791
Net cash from investing activities – (655) (75) (9,559) (54) (10,343)
Net cash from financing activities (6,650) (564) (207) (8,953) 6,518 (9,856)
Net Increase in Cash $– $– $– $1,592 $– $1,592
76
Notes to Consolidated Financial Statements continued