Verizon Wireless 2006 Annual Report Download - page 31
Download and view the complete annual report
Please find page 31 of the 2006 Verizon Wireless annual report below. You can navigate through the pages in the report by either clicking on the pages listed below, or by using the keyword search tool below to find specific information within the annual report.-
 1
1 -
2
-
3
-
4
-
5
-
6
-
7
-
8
-
9
-
10
-
11
-
12
-
13
-
14
-
15
-
16
-
17
-
18
-
19
-
20
-
 21
21 -
 22
22 -
 23
23 -
 24
24 -
 25
25 -
 26
26 -
 27
27 -
 28
28 -
 29
29 -
 30
30 -
 31
31 -
 32
32 -
 33
33 -
 34
34 -
 35
35 -
 36
36 -
 37
37 -
 38
38 -
 39
39 -
 40
40 -
 41
41 -
42
-
43
-
44
-
45
-
46
-
47
-
48
-
49
-
50
-
51
-
52
-
53
-
54
-
55
-
56
-
57
-
58
-
59
-
60
-
61
-
62
-
63
-
64
-
65
-
66
-
67
-
68
-
69
-
70
-
71
-
72
-
73
-
74
-
75
-
76
-
77
-
78
-
79
-
80
-
81
-
82
-
83
-
84
 |
 |

29
pertaining to our international long distance and data network. In
addition, we recorded pretax charges of $55 million ($34 million
after-tax, or $.01 per diluted share) in connection with the early
extinguishment of debt.
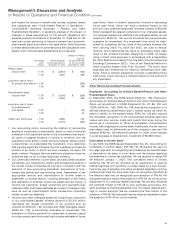
CONSOLIDATED FINANCIAL CONDITION
(dollars in millions)
Years Ended December 31, 2006 2005 2004
Cash Flows Provided By (Used In)
Operating activities $24,106 $22,025 $ 21,791
Investing activities (15,616) (18,492) (10,343)
Financing activities (6,031) (5,034) (9,856)
Increase (Decrease) In Cash and
Cash Equivalents $ 2,459 $(1,501) $ 1,592
We use the net cash generated from our operations to fund network
expansion and modernization, repay external financing, pay divi-
dends and invest in new businesses. Additional external financing is
utilized when necessary. While our current liabilities typically exceed
current assets, our sources of funds, primarily from operations and,
to the extent necessary, from readily available external financing
arrangements, are sufficient to meet ongoing operating and
investing requirements. We expect that capital spending require-
ments will continue to be financed primarily through internally
generated funds. Additional debt or equity financing may be needed
to fund additional development activities or to maintain our capital
structure to ensure our financial flexibility.
Cash Flows Provided By Operating Activities
Our primary source of funds continues to be cash generated from
operations. In 2006, the increase in cash from operating activities
compared to 2005 was primarily due to higher earnings at Domestic
Wireless, which included higher minority interest earnings, and lower
dividends paid to minority partners. Total minority interest earnings,
net of dividends paid to minority interest partners, was $3.2 billion in
2006 compared to $1.7 billion in 2005. In addition, higher operating
cash flow in 2006 compared to 2005 was due to lower cash taxes
paid in 2006, resulting from 2005 tax payments related to foreign
operations and investments sold during the fourth quarter of 2004.
Partially offsetting these increases were significant 2005 repatriations
of foreign earnings of unconsolidated businesses.
In 2005, the increase in cash from operations compared to 2004 was
primarily driven higher by the repatriation of $2.2 billion of foreign
earnings from unconsolidated businesses, higher minority interest
earnings, net of dividends paid to minority partners of $1.0 billion and
lower severance payments in 2005. These increases were largely
offset by higher cash income tax payments, including taxes paid in
2005 related to the 2004 sales of Verizon Information Services Canada
and TELUS shares, and higher pension fund contributions.
Operating cash flows from discontinued operations decreased $505
million to $1,076 million in 2006 due to the completion of the Idearc
spin-off on November 17, 2006 and the close of the sale of Verizon
Dominicana on December 1, 2006, partially offset by the operating
activities of the remaining assets held for sale. Operating cash flows
from discontinued operations decreased $34 million from $1,615
million in 2004 to $1,581 million in 2005 due to the completion of the
sale of Verizon Information Services Canada in the fourth quarter of
2004, partially offset by operating activities of the remaining assets
held for sale.
Cash Flows Used In Investing Activities
Capital expenditures continue to be our primary use of capital
resources as they facilitate the introduction of new products and serv-
ices, enhance responsiveness to competitive challenges and increase
the operating efficiency and productivity of our networks. Including
capitalized software, we invested $10,259 million in our Wireline busi-
ness in 2006, compared to $8,267 million and $7,118 million in 2005
and 2004, respectively. We also invested $6,618 million in our Verizon
Wireless business in 2006, compared to $6,484 million and $5,633 mil-
lion in 2005 and 2004, respectively. The increase in capital spending at
Wireline is mainly driven by the acquisition of MCI, coupled with
increased spending in high growth areas such as broadband. Capital
spending at Verizon Wireless represents our continuing effort to invest
in this high growth business.
In 2007, capital expenditures including capitalized software are
expected to be in the range of $17.5 billion to $17.9 billion.
In 2006, we invested $1,422 million in acquisitions and investments
in businesses, including $2,809 million to acquire thirteen 20 MHz
licenses in connection with the FCC Advanced Wireless Services
auction and $57 million to acquire other wireless properties. This
was offset by MCI’s cash balances of $2,361 million at the date of
the merger, of which $779 million was used for a cash payment to
MCI shareholders. In 2005, we invested $4,684 million in acquisi-
tions and investments in businesses, including $3,003 million to
acquire NextWave Telecom Inc. (NextWave) personal communica-
tions services licenses, $641 million to acquire 63 broadband
wireless licenses in connection with FCC auction 58, $419 million to
purchase Qwest Wireless, LLC’s spectrum licenses and wireless
network assets in several existing and new markets, $230 million to
purchase spectrum from MetroPCS, Inc. and $297 million for other
wireless properties and licenses. In 2004, we invested $1,196 million
in acquisitions and investments in businesses, including $1,052 mil-
lion for wireless licenses and businesses, including a NextWave
license covering the New York metropolitan area, and $144 million
related to Verizon’s limited partnership investments in entities that
invest in affordable housing projects.
In 2005, we received cash proceeds of $1,326 million in connection
with the sale of Verizon’s wireline operations in Hawaii. In 2004, we
received cash proceeds of $117 million from the sale of a small
business unit.
Our short-term investments include principally cash equivalents held
in trust accounts for payment of employee benefits. In 2006, 2005
and 2004, we invested $1,915 million, $1,955 million and $1,801 mil-
lion, respectively, in short-term investments, primarily to pre-fund
active employees’ health and welfare benefits. Proceeds from the
sales of all short-term investments, principally for the payment of
these benefits, were $2,205 million, $1,609 million and $1,711 million
in the years 2006, 2005 and 2004, respectively.
Other, net investing activities for 2006 include cash proceeds of
$283 million from property sales. Other, net investing activities for
2005 includes a net investment of $913 million for the purchase of
43.4 million shares of MCI common stock from eight entities affili-
ated with Carlos Slim Helú, offset by cash proceeds of $713 million
from property sales, including a New York City office building, and
$349 million of repatriated proceeds from the sales of European
investments in prior years. Other, net investing activities for 2004
includes net cash proceeds of $1,632 million received in connection
with the sale of our 20.5% interest in TELUS and $650 million in
Management’s Discussion and Analysis
of Results of Operations and Financial Condition continued