Verizon Wireless 2006 Annual Report Download - page 77
Download and view the complete annual report
Please find page 77 of the 2006 Verizon Wireless annual report below. You can navigate through the pages in the report by either clicking on the pages listed below, or by using the keyword search tool below to find specific information within the annual report.-
 1
1 -
2
-
3
-
4
-
5
-
6
-
7
-
8
-
9
-
10
-
11
-
12
-
13
-
14
-
15
-
16
-
17
-
18
-
19
-
20
-
21
-
22
-
23
-
24
-
25
-
26
-
27
-
28
-
29
-
30
-
31
-
32
-
33
-
34
-
35
-
36
-
37
-
38
-
39
-
40
-
41
-
42
-
43
-
44
-
45
-
46
-
47
-
48
-
49
-
50
-
51
-
52
-
53
-
54
-
55
-
56
-
57
-
58
-
59
-
60
-
61
-
62
-
63
-
64
-
65
-
66
-
 67
67 -
 68
68 -
 69
69 -
 70
70 -
 71
71 -
 72
72 -
 73
73 -
 74
74 -
 75
75 -
 76
76 -
 77
77 -
 78
78 -
 79
79 -
 80
80 -
 81
81 -
 82
82 -
 83
83 -
 84
84
 |
 |

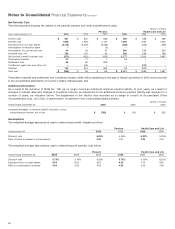
Notes to Consolidated Financial Statements continued
75
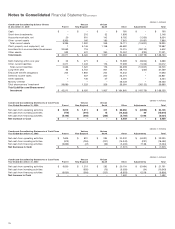
(dollars in millions)
Condensed Consolidating Statements of Income Verizon Verizon
Year Ended December 31, 2004 Parent New England South Other Adjustments Total
Operating revenues $ – $ 3,955 $ 934 $ 61,224 $ (362) $ 65,751
Operating expenses 260 3,664 717 50,602 (362) 54,881
Operating Income (Loss) (260) 291 217 10,622 – 10,870
Equity in earnings of unconsolidated
businesses 7,714 59 – 1,437 (7,520) 1,690
Other income and (expense), net 171 8 7 98 (202) 82
Interest expense (20) (165) (63) (2,096) 8 (2,336)
Minority interest – – – (2,329) – (2,329)
Income before provision for income taxes
and discontinued operations 7,605 193 161 7,732 (7,714) 7,977
Income tax benefit (provision) 229 (50) (34) (2,223) – (2,078)
Income Before Discontinued Operations 7,834 143 127 5,509 (7,714) 5,899
Income (loss) on discontinued operations,
net of tax (3) – – 1,935 – 1,932
Net Income $7,831 $ 143 $ 127 $ 7,444 $ (7,714) $ 7,831
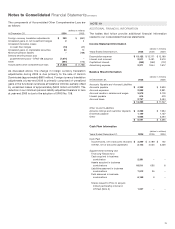
(dollars in millions)
Condensed Consolidating Balance Sheets Verizon Verizon
At December 31, 2006 Parent New England South Other Adjustments Total
Cash $– $– $– $3,219 $– $3,219
Short-term investments –215 33 2,186 – 2,434
Accounts receivable, net 4705 104 10,999 (921) 10,891
Other current assets 32,680 134 28 5,830 (32,678) 5,994
Total current assets 32,684 1,054 165 22,234 (33,599) 22,538
Plant, property and equipment, net 16,165 1,120 75,070 – 82,356
Investments in unconsolidated businesses 44,048 116 – 7,488 (46,784) 4,868
Other assets 5,045 288 389 73,550 (230) 79,042
Total Assets $ 81,778 $ 7,623 $ 1,674 $ 178,342 $ (80,613) $ 188,804
Debt maturing within one year $6,735 $ 333 $ 232 $ 33,302 $ (32,887) $ 7,715
Other current liabilities 2,354 1,032 182 21,709 (712) 24,565
Total current liabilities 9,089 1,365 414 55,011 (33,599) 32,280
Long-term debt 11,392 2,573 417 14,494 (230) 28,646
Employee benefit obligations 12,419 1,625 259 16,476 – 30,779
Deferred income taxes 337 560 203 15,170 – 16,270
Other liabilities 6111 19 3,821 – 3,957
Minority interest –––28,337 – 28,337
Total shareowners’ investment 48,535 1,389 362 45,033 (46,784) 48,535
Total Liabilities and Shareowners’
Investment $ 81,778 $ 7,623 $ 1,674 $ 178,342 $ (80,613) $ 188,804