Verizon Wireless 2006 Annual Report Download - page 69
Download and view the complete annual report
Please find page 69 of the 2006 Verizon Wireless annual report below. You can navigate through the pages in the report by either clicking on the pages listed below, or by using the keyword search tool below to find specific information within the annual report.-
 1
1 -
2
-
3
-
4
-
5
-
6
-
7
-
8
-
9
-
10
-
11
-
12
-
13
-
14
-
15
-
16
-
17
-
18
-
19
-
20
-
21
-
22
-
23
-
24
-
25
-
26
-
27
-
28
-
29
-
30
-
31
-
32
-
33
-
34
-
35
-
36
-
37
-
38
-
39
-
40
-
41
-
42
-
43
-
44
-
45
-
46
-
47
-
48
-
49
-
50
-
51
-
52
-
53
-
54
-
55
-
56
-
57
-
58
-
 59
59 -
 60
60 -
 61
61 -
 62
62 -
 63
63 -
 64
64 -
 65
65 -
 66
66 -
 67
67 -
 68
68 -
 69
69 -
 70
70 -
 71
71 -
 72
72 -
 73
73 -
 74
74 -
 75
75 -
 76
76 -
 77
77 -
 78
78 -
 79
79 -
80
-
81
-
82
-
83
-
84
 |
 |

Notes to Consolidated Financial Statements continued
67
In order to project the long-term target investment return for the
total portfolio, estimates are prepared for the total return of each
major asset class over the subsequent 10-year period, or longer.
Those estimates are based on a combination of factors including
the following: current market interest rates and valuation levels,
consensus earnings expectations, historical long-term risk pre-
miums and value-added. To determine the aggregate return for the
pension trust, the projected return of each individual asset class is
then weighted according to the allocation to that investment area in
the trust’s long-term asset allocation policy.
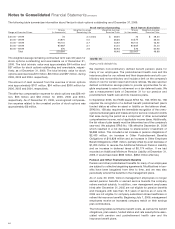
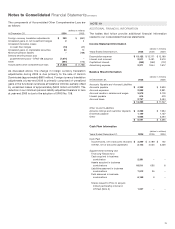
The assumed Health Care Cost Trend Rates follow:
Health Care and Life
At December 31, 2006 2005 2004
Health care cost trend rate assumed
for next year 10.00% 10.00% 10.00%
Rate to which cost trend rate
gradually declines 5.00 5.00 5.00
Year the rate reaches level it is assumed
to remain thereafter 2011 2010 2009
A one-percentage-point change in the assumed health care cost
trend rate would have the following effects:
(dollars in millions)
One-Percentage-Point Increase Decrease
Effect on 2006 service and interest cost $ 282 $ (223)
Effect on postretirement benefit obligation
as of December 31, 2006 3,339 (2,731)
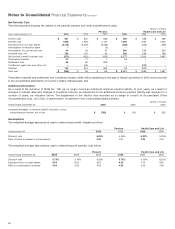
Plan Assets
Pension Plans
The weighted-average asset allocations for the pension plans by
asset category follow:
At December 31, 2006 2005
Asset Category
Equity securities 62.5% 63.4%
Debt securities 16.3 17.5
Real estate 4.5 3.2
Other 16.7 15.9
Total 100.0% 100.0%
Equity securities include Verizon common stock of $95 million and
$72 million at December 31, 2006 and 2005, respectively. Other
assets include cash and cash equivalents (primarily held for the
payment of benefits), private equity and investments in absolute
return strategies.
Health Care and Life Plans
The weighted-average asset allocations for the other postretirement
benefit plans by asset category follow:
At December 31, 2006 2005
Asset Category
Equity securities 72.1% 71.9%
Debt securities 20.4 22.1
Real estate 0.1 0.1
Other 7.4 5.9
Total 100.0% 100.0%
Equity securities include Verizon common stock of $4 million at
December 31, 2005. There was no Verizon common stock held at
the end of 2006.
The portfolio strategy emphasizes a long-term equity orientation,
significant global diversification, the use of both public and private
investments and professional financial and operational risk controls.
Assets are allocated according to a long-term policy neutral position
and held within a relatively narrow and pre-determined range. Both
active and passive management approaches are used depending on
perceived market efficiencies and various other factors.
Cash Flows
In 2006, we contributed $451 million to our qualified pension trusts,
$117 million to our nonqualified pension plans and $1,099 million to
our other postretirement benefit plans. We estimate required quali-
fied pension trust contributions for 2007 to be approximately $510
million. We also anticipate $120 million in contributions to our
non-qualified pension plans and $1,210 million to our other post-
retirement benefit plans in 2007.
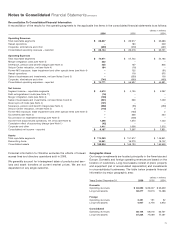
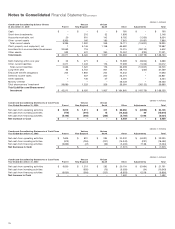
Estimated Future Benefit Payments
The benefit payments to retirees, which reflect expected future
service, are expected to be paid as follows:
(dollars in millions)
Health Care and
Life Prior to Expected
Pension Medicare Prescription Medicare Prescription
Benefits Drug Subsidy Drug Subsidy
2007 $ 2,491 $ 1,717 $ 91
2008 2,552 1,806 97
2009 2,749 1,869 102
2010 3,042 1,936 108
2011 3,503 1,991 112
2012 – 2016 16,472 9,983 589
Savings Plan and Employee Stock Ownership Plans
We maintain four leveraged employee stock ownership plans
(ESOP), only one plan currently has unallocated shares. Under this
plan, we match a certain percentage of eligible employee contribu-
tions to the savings plans with shares of our common stock from
this ESOP. Common stock is allocated from the leveraged ESOP
trust based on the proportion of principal and interest paid on
ESOP debt in a year to the remaining principal and interest due over
the term of the debt. The final debt service payments and related
share allocations for two of our leveraged ESOPs were made in
2004. At December 31, 2006, the number of unallocated and allo-
cated shares of common stock was 5 million and 77 million,
respectively. All leveraged ESOP shares are included in earnings
per share computations.
Total savings plan costs were $669 million, $499 million, and $501
million in 2006, 2005 and 2004 respectively. A portion of these
costs were funded through a leveraged ESOP. We recognize lever-
aged ESOP costs based on the shares allocated method.
Leveraged ESOP costs and trust activity consist of the following:
(dollars in millions)
Years Ended December 31, 2006 2005 2004
Compensation $24$39$159
Interest incurred ––12
Dividends (9) (16) (16)
Net leveraged ESOP cost $15$23$155