Verizon Wireless 2006 Annual Report Download - page 22
Download and view the complete annual report
Please find page 22 of the 2006 Verizon Wireless annual report below. You can navigate through the pages in the report by either clicking on the pages listed below, or by using the keyword search tool below to find specific information within the annual report.-
 1
1 -
2
-
3
-
4
-
5
-
6
-
7
-
8
-
9
-
10
-
11
-
 12
12 -
 13
13 -
 14
14 -
 15
15 -
 16
16 -
 17
17 -
 18
18 -
 19
19 -
 20
20 -
 21
21 -
 22
22 -
 23
23 -
 24
24 -
 25
25 -
 26
26 -
 27
27 -
 28
28 -
 29
29 -
 30
30 -
 31
31 -
 32
32 -
33
-
34
-
35
-
36
-
37
-
38
-
39
-
40
-
41
-
42
-
43
-
44
-
45
-
46
-
47
-
48
-
49
-
50
-
51
-
52
-
53
-
54
-
55
-
56
-
57
-
58
-
59
-
60
-
61
-
62
-
63
-
64
-
65
-
66
-
67
-
68
-
69
-
70
-
71
-
72
-
73
-
74
-
75
-
76
-
77
-
78
-
79
-
80
-
81
-
82
-
83
-
84
 |
 |

2006 Compared to 2005
Consolidated revenues in 2006 were higher by $18,626 million, or
26.8% compared to 2005 revenues. This increase was primarily the
result of significantly higher revenues at Wireline and Domestic
Wireless.
Wireline’s revenues in 2006 increased by $13,178 million, or 35.0%
compared to 2005 due to the acquisition of MCI and growth from
broadband and long distance services. We added 1.8 million new
broadband connections, for a total of 7.0 million lines in service at
December 31, 2006, an increase of 35.7% compared to 5.1 million
lines in service at December 31, 2005. The number of Freedom
service plans continue to stimulate growth in long distance services,
as the number of packages reached 7.9 million as of December 31,
2006, representing a 44.1% increase from December 31, 2005.
These increases were partially offset by declines in wholesale rev-
enues at Verizon Telecom due to subscriber losses resulting from
technology substitution, including wireless and VoIP. Wholesale rev-
enues at Verizon Telecom declined by $752 million, or 8.3% in 2006
compared to similar periods in 2005 primarily due to the exclusion of
affiliated access revenues billed to the former MCI mass market enti-
ties in 2006. Revenues at Verizon Business increased primarily due
to the acquisition of MCI.
Domestic Wireless’s revenues increased by $5,742 million, or 17.8%
compared to 2005 due to increases in service revenues, including
data revenues, and equipment and other revenues. Data revenues
increased by $2,232 million or 99.5% compared to 2005. Domestic
Wireless ended 2006 with 59.1 million customers, an increase of
15.0% over 2005. Domestic Wireless’s retail customer base as of
December 31, 2006 was approximately 56.8 million, a 15.9%
increase over December 31, 2005, and comprised approximately
96.1% of our total customer base. Average service revenue per cus-
tomer (ARPU) increased by 0.6% to $49.80 in 2006 compared to
2005, primarily attributable to increases in data revenue per cus-
tomer driven by increased use of our messaging and other data
services. Retail ARPU increased by 0.7% to $50.44 for 2006 com-
pared to 2005. Increases in wireless devices sold and revenue per
unit sold drove increases in equipment and other revenue in 2006
compared to 2005.
Lower revenue of Hawaii operations sold of $180 million, or 100% in
2006 compared to 2005 was the result of their sale during the
second quarter of 2005.
2005 Compared to 2004
Consolidated revenues in 2005 were higher by $3,767 million, or
5.7% compared to 2004 revenues. This increase was primarily the
result of significantly higher revenues at Domestic Wireless, partially
offset by lower revenues at Wireline and the sale of our Hawaii wire-
line operations in the second quarter of 2005.
Wireline’s revenues in 2005 were lower than 2004 by $405 million, or
1.1% primarily due to lower revenues from local services, partially
offset by higher network access and long distance services rev-
enues. We added 1.7 million new broadband connections, for a total
of 5.1 million lines in service at December 31, 2005, an increase of
47.6% compared to 3.5 million lines in service at December 31,
2004. The introduction of our Freedom service plans stimulated
growth in long distance services. As of December 31, 2005, approx-
imately 53% of our local wireline customers chose Verizon as their
long distance carrier. These increases were offset by declines in
wholesale revenues at Verizon Telecom due to subscriber losses
resulting from technology substitution, including wireless and VoIP.
Domestic Wireless’s revenues increased by $4,639 million, or 16.8%
in 2005 compared to 2004 due to increases in service revenues,
including data revenues, and equipment and other revenues. Data
revenues increased by $1,127 million or 101.0% compared to 2004.
Domestic Wireless ended 2005 with 51.3 million customers, an
increase of 17.2% over 2004. Domestic Wireless’s retail customer
base as of December 31, 2005 was approximately 49.0 million, a
17.2% increase over December 31, 2004, and comprised approxi-
mately 95.5% of our total customer base. ARPU decreased 1.5% to
$49.49 in 2005 compared to 2004, primarily due to pricing changes
in early 2005, partially offset by a 71.7% increase in data revenue
per customer in 2005 compared to 2004, driven by increased use of
our messaging and other data services. Increases in wireless
devices sold and revenue per unit sold drove increases in equipment
and other revenue in 2005 compared to 2004.
Lower revenue of Hawaii operations sold of $349 million, or 66.0% in
2005 compared to 2004 was the result of the sale during the second
quarter of 2005 of our wireline and directory operations in Hawaii.
20
Management’s Discussion and Analysis
of Results of Operations and Financial Condition continued
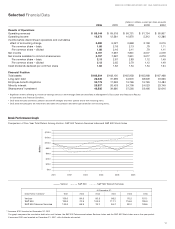
Consolidated Revenues
(dollars in millions)
Years Ended December 31, 2006 2005 % Change 2005 2004 % Change
Wireline
Verizon Telecom $33,259 $32,114 $ 32,114 $ 32,261
Verizon Business 20,490 7,394 7,394 7,414
Intrasegment eliminations (2,955) (1,892) (1,892) (1,654)
50,794 37,616 35.0% 37,616 38,021 (1.1)%
Domestic Wireless 38,043 32,301 17.8 32,301 27,662 16.8
Corporate & Other (693) (579) 19.7 (579) (461) 25.6
Revenues of Hawaii operations sold –180 (100.0) 180 529 (66.0)
Consolidated Revenues $88,144 $69,518 26.8 $ 69,518 $ 65,751 5.7