Verizon Wireless 2006 Annual Report Download - page 24
Download and view the complete annual report
Please find page 24 of the 2006 Verizon Wireless annual report below. You can navigate through the pages in the report by either clicking on the pages listed below, or by using the keyword search tool below to find specific information within the annual report.-
 1
1 -
2
-
3
-
4
-
5
-
6
-
7
-
8
-
9
-
10
-
11
-
12
-
13
-
 14
14 -
 15
15 -
 16
16 -
 17
17 -
 18
18 -
 19
19 -
 20
20 -
 21
21 -
 22
22 -
 23
23 -
 24
24 -
 25
25 -
 26
26 -
 27
27 -
 28
28 -
 29
29 -
 30
30 -
 31
31 -
 32
32 -
 33
33 -
 34
34 -
35
-
36
-
37
-
38
-
39
-
40
-
41
-
42
-
43
-
44
-
45
-
46
-
47
-
48
-
49
-
50
-
51
-
52
-
53
-
54
-
55
-
56
-
57
-
58
-
59
-
60
-
61
-
62
-
63
-
64
-
65
-
66
-
67
-
68
-
69
-
70
-
71
-
72
-
73
-
74
-
75
-
76
-
77
-
78
-
79
-
80
-
81
-
82
-
83
-
84
 |
 |

bad debt costs. Special and non-recurring items in selling, general
and administrative expenses in 2005 were $311 million compared to
special and non-recurring items in 2004 of $971 million.
Special and non-recurring items in 2005 included a pretax impair-
ment charge of $125 million pertaining to our leasing operations for
aircraft leased to airlines experiencing financial difficulties, a net
pretax charge of $98 million related to the restructuring of the
Verizon management retirement benefit plans and a pretax charge of
$59 million associated with employee severance costs and sever-
ance-related activities in connection with the voluntary separation
program to surplus union-represented employees. Special and non-
recurring items recorded in 2004 included $805 million related to
pension settlement losses incurred in connection with the voluntary
separation of approximately 21,000 employees in the fourth quarter
of 2003 who received lump-sum distributions during 2004. Special
charges in 2004 also include an expense credit of $204 million
resulting from the favorable resolution of pre-bankruptcy amounts
due from MCI, partially offset by a charge of $113 million related to
operating asset losses.
Depreciation and Amortization Expense
Depreciation and amortization expense increased by $112 million, or
0.8% in 2005 compared to 2004. This increase was primarily due to
the increase in depreciable assets and software, partially offset by
lower rates of depreciation on telephone plant.
Sales of Businesses, Net
During the second quarter of 2005, we sold our wireline and directory
businesses in Hawaii and recorded a net pretax gain of $530 million.
Pension and Other Postretirement Benefits
For 2006 pension and other postretirement benefit costs, the dis-
count rate assumption remained at 5.75%, consistent with interest
rate levels at the end of 2005. The expected rate of return on pen-
sion plan assets remained 8.50%, while the expected rate of return
on postretirement benefit plan assets was increased to 8.25% from
7.75% in 2005. The medical cost trend rate was 10% for 2006. For
2005 pension and other postretirement benefit costs, the discount
rate assumption was lowered to 5.75% from 6.25% in 2004, consis-
tent with interest rate levels at the end of 2004. The medical cost
trend rate assumption was 10% in 2005. The expected rate of return
on pension and postretirement benefit plan assets for 2004 was
maintained at 8.50%.
For 2007 pension and other postretirement benefit costs, we evalu-
ated our key employee benefit plan assumptions in response to
current conditions in the securities markets and medical and pre-
scription drug cost trends. The discount rate assumption will be
increased to 6.00%, consistent with interest rate levels at the end of
2006. The medical cost trend rate will be 10% for 2007. The
expected rate of return on pension plan assets will remain at 8.50%
and the expected rate of return on postretirement benefit plan
assets will remain at 8.25% in 2007.
During 2006, we recorded net pension and postretirement benefit
expense of $1,377 million compared to net pension and postretire-
ment benefit expense of $1,231 million in 2005 and net pension and
postretirement benefit expense of $824 million in 2004.
Other Consolidated Results
Equity in Earnings of Unconsolidated Businesses
Equity in earnings of unconsolidated businesses increased by $87
million, or 12.7% in 2006 compared to 2005. The increase is primarily
due to additional pension liabilities that Campañia Anónima Nacional
Teléfonos de Venezuela (CANTV) recognized in 2005, as well as the
effect of favorable operating results and lower taxes in 2006. In addi-
tion, the increase reflects our proportionate share, or $85 million, of a
tax benefit at Vodafone Omnitel N.V. (Vodafone Omnitel) in the third
quarter of 2006. A similar benefit was recorded in the third quarter of
2005 of $76 million.
Equity in earnings of unconsolidated businesses decreased by
$1,004 million, or 59.4% in 2005 compared to 2004. The decrease is
primarily due to a pretax gain of $787 million recorded on the sale of
our 20.5% interest in TELUS Corporation (TELUS) in the fourth
quarter of 2004 and the sale of another investment in 2004, lower
equity income resulting from the sale of TELUS and estimated addi-
tional pension liabilities at CANTV, partially offset by higher tax
benefits and operational results at Vodafone Omnitel.
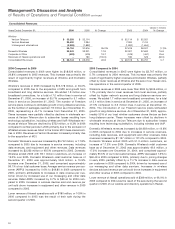
Other Income and (Expense), Net (dollars in millions)
Years Ended December 31, 2006 2005 2004
Interest income $201 $103 $ 97
Foreign exchange gains (losses), net (3) 11 (7)
Other, net 197 197 (8)
Total $395 $311 $ 82
Other Income and (Expense), Net in 2006 increased $84 million, or
27% compared to 2005. The increase was primarily due to increased
interest income as a result of higher average cash balances coupled
with higher interest rates in 2006 compared to 2005, partially offset
by foreign exchange losses. Other, net in 2006 includes pretax gains
on sales of investments and marketable securities, as well as leased
asset gains.
Other, net in 2005 includes a pretax gain on the sale of a small inter-
national business and investment gains. Other Income and
(Expense), Net in 2005 and 2004 include expenses of $14 million
and $55 million, respectively, related to the early retirement of debt.
Interest Expense (dollars in millions)
Years Ended December 31, 2006 2005 2004
Interest expense $2,349 $2,129 $ 2,336
Capitalized interest costs 462 352 177
Total interest costs on debt balances $2,811 $2,481 $ 2,513
Weighted average debt outstanding $41,500 $39,152 $ 41,781
Effective interest rate 6.8% 6.3% 6.0%
In 2006, interest costs increased $330 million compared to 2005 pri-
marily due to an increase in average debt level of $2,348 million and
increased interest rates compared to 2005. Higher capital expendi-
tures in 2006 contributed to higher capitalized interest costs.
In 2005, the decrease in interest costs was primarily due to a reduc-
tion in average debt level of $2,629 million compared to 2004,
partially offset by higher average interest rates. Higher capital expen-
ditures in 2005 contributed to higher capitalized interest costs.
22
Management’s Discussion and Analysis
of Results of Operations and Financial Condition continued