Verizon Wireless 2006 Annual Report Download - page 46
Download and view the complete annual report
Please find page 46 of the 2006 Verizon Wireless annual report below. You can navigate through the pages in the report by either clicking on the pages listed below, or by using the keyword search tool below to find specific information within the annual report.-
 1
1 -
2
-
3
-
4
-
5
-
6
-
7
-
8
-
9
-
10
-
11
-
12
-
13
-
14
-
15
-
16
-
17
-
18
-
19
-
20
-
21
-
22
-
23
-
24
-
25
-
26
-
27
-
28
-
29
-
30
-
31
-
32
-
33
-
34
-
35
-
 36
36 -
 37
37 -
 38
38 -
 39
39 -
 40
40 -
 41
41 -
 42
42 -
 43
43 -
 44
44 -
 45
45 -
 46
46 -
 47
47 -
 48
48 -
 49
49 -
 50
50 -
 51
51 -
 52
52 -
 53
53 -
 54
54 -
 55
55 -
 56
56 -
57
-
58
-
59
-
60
-
61
-
62
-
63
-
64
-
65
-
66
-
67
-
68
-
69
-
70
-
71
-
72
-
73
-
74
-
75
-
76
-
77
-
78
-
79
-
80
-
81
-
82
-
83
-
84
 |
 |

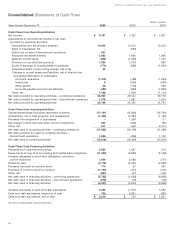
44
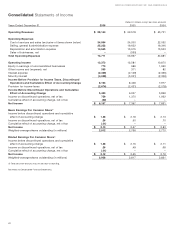
(dollars in millions)
Years Ended December 31, 2006 2005 2004
Cash Flows from Operating Activities
Net Income $6,197 $7,397 $ 7,831
Adjustments to reconcile net income to net cash
provided by operating activities:
Depreciation and amortization expense 14,545 13,615 13,503
Sales of businesses, net –(530) –
(Gain) loss on sale of discontinued operations 541 ––
Employee retirement benefits 1,923 1,695 1,836
Deferred income taxes (252) (1,093) 1,721
Provision for uncollectible accounts 1,034 1,076 890
Equity in earnings of unconsolidated businesses (773) (686) (1,690)
Cumulative effect of accounting change, net of tax 42 ––
Changes in current assets and liabilities, net of effects from
acquisition/disposition of businesses:
Accounts receivable (1,312) (788) (1,293)
Inventories 8(236) (226)
Other assets 52 (176) 539
Accounts payable and accrued liabilities (383) (899) (1,820)
Other, net 1,408 1,069 (1,115)
Net cash provided by operating activities – continuing operations 23,030 20,444 20,176
Net cash provided by operating activities – discontinued operations 1,076 1,581 1,615
Net cash provided by operating activities 24,106 22,025 21,791
Cash Flows from Investing Activities
Capital expenditures (including capitalized software) (17,101) (14,964) (12,794)
Acquisitions, net of cash acquired, and investments (1,422) (4,684) (1,196)
Proceeds from disposition of businesses –1,326 117
Net change in short-term and other current investments 290 (346) (90)
Other, net 811 532 2,474
Net cash used in investing activities – continuing operations (17,422) (18,136) (11,489)
Net cash provided by (used in) investing activities –
discontinued operations 1,806 (356) 1,146
Net cash used in investing activities (15,616) (18,492) (10,343)
Cash Flows from Financing Activities
Proceeds from long-term borrowings 3,983 1,487 514
Repayments of long-term borrowings and capital lease obligations (11,233) (3,825) (5,168)
Increase (decrease) in short-term obligations, excluding
current maturities 7,944 2,098 (747)
Dividends paid (4,719) (4,427) (4,262)
Proceeds from sale of common stock 174 37 320
Purchase of common stock for treasury (1,700) (271) (370)
Other, net (201) (57) (125)
Net cash used in financing activities – continuing operations (5,752) (4,958) (9,838)
Net cash used in financing activities – discontinued operations (279) (76) (18)
Net cash used in financing activities (6,031) (5,034) (9,856)
Increase (decrease) in cash and cash equivalents 2,459 (1,501) 1,592
Cash and cash equivalents, beginning of year 760 2,261 669
Cash and cash equivalents, end of year $3,219 $760 $ 2,261
See Notes to Consolidated Financial Statements.
VERIZON COMMUNICATIONS INC. AND SUBSIDIARIES
Consolidated Statements of Cash Flows