Verizon Wireless 2006 Annual Report Download - page 28
Download and view the complete annual report
Please find page 28 of the 2006 Verizon Wireless annual report below. You can navigate through the pages in the report by either clicking on the pages listed below, or by using the keyword search tool below to find specific information within the annual report.-
 1
1 -
2
-
3
-
4
-
5
-
6
-
7
-
8
-
9
-
10
-
11
-
12
-
13
-
14
-
15
-
16
-
17
-
 18
18 -
 19
19 -
 20
20 -
 21
21 -
 22
22 -
 23
23 -
 24
24 -
 25
25 -
 26
26 -
 27
27 -
 28
28 -
 29
29 -
 30
30 -
 31
31 -
 32
32 -
 33
33 -
 34
34 -
 35
35 -
 36
36 -
 37
37 -
 38
38 -
39
-
40
-
41
-
42
-
43
-
44
-
45
-
46
-
47
-
48
-
49
-
50
-
51
-
52
-
53
-
54
-
55
-
56
-
57
-
58
-
59
-
60
-
61
-
62
-
63
-
64
-
65
-
66
-
67
-
68
-
69
-
70
-
71
-
72
-
73
-
74
-
75
-
76
-
77
-
78
-
79
-
80
-
81
-
82
-
83
-
84
 |
 |

26
assumption changes combined with the impact of lower than
expected actual asset returns over the past several years, resulted in
pension and other postretirement benefit expense of $1,408 million
(primarily in cost of services and sales) in 2006 compared to net
pension and postretirement benefit expense of $1,248 million in
2005. Further, expenses decreased in both years due to the discon-
tinuation of non-strategic businesses, including the termination of a
large commercial inventory management contract in 2005.
In 2005, our cost of services and sales increased by $774 million, or
5.2% compared to 2004. Costs in 2005 were impacted by increased
pension and other postretirement benefit costs. At December 31,
2004, in connection with an evaluation of key employee benefit plan
assumptions, the discount rate assumption was lowered from 6.25%
in 2004 to 5.75% in 2005, consistent with interest rate levels at the
end of 2004. Further, there was an increase in the retiree health care
cost trend rates. The overall impact of these assumption changes,
combined with the impact of lower than expected actual asset
returns over the last several years, resulted in net pension and other
postretirement benefit expense (primarily in cost of services and
sales) of $1,248 million in 2005, compared to net pension and
postretirement benefit expense of $803 million in 2004. Also con-
tributing to expense increases in cost of services and sales were
higher costs associated with our growth businesses. Further, the
expense increase was impacted by favorable adjustments to our
interconnection expense in 2004, as a result of our ongoing reviews
of local interconnection expense charged by CLECs and settlements
with carriers.
Selling, General and Administrative Expense
Selling, general and administrative expenses in 2006 increased by
$3,697 million or 43.9% compared to 2005. These increases were
primarily due to the inclusion of expenses from the former MCI in
2006 partially offset by synergy savings resulting from our merger
integration efforts, the impact of gains from real estate sales and
lower bad debt costs.
In 2005, our selling, general and administrative expense decreased
by $202 million, or 2.3% compared to 2004. This decrease was
attributable to gains on the sale of real estate in 2005, lower property
and gross receipts taxes and reduced bad debt costs, partially offset
by higher net pension and benefit costs, as described above, and a
prior year gain on the sale of two small business units.
Depreciation and Amortization Expense
The increase in depreciation and amortization expense of $789 mil-
lion, or 9.0% in 2006 was mainly driven by the acquisition of MCI’s
depreciable property and equipment and finite-lived intangibles,
including its customer lists and capitalized non-network software,
measured at fair value and by growth in depreciable telephone plant
and non-network software assets. The decrease in depreciation and
amortization expense of $109 million or 1.2%, in 2005 compared to
2004 was mainly driven by lower rates of depreciation, partially
offset by higher plant, property and equipment balances and soft-
ware amortization costs.
Segment Income (dollars in millions)
Years Ended December 31, 2006 2005 2004
Segment Income $1,634 $1,906 $ 2,652
Segment income decreased by $272 million, or 14.3% in 2006 and
by $746 million, or 28.1% in 2005, due to the after-tax impact of
operating revenues and operating expenses described above, along
with the impact of favorable income tax adjustments in 2005.
Special and non-recurring items not included in Verizon Wireline’s
segment income totaled $407 million, ($168) million and $346 million
in 2006, 2005, and 2004 respectively. Special and non-recurring
items in 2006 included costs associated with severance activity,
pension settlement losses, Verizon Center relocation-related costs,
and merger integration costs. Merger integration costs primarily
included costs related to advertising and re-branding initiatives, and
labor and contractor costs related to information technology integra-
tion initiatives. Special and non-recurring items in 2005 related to the
Hawaii results of operations and gain on the sale of the Hawaii wire-
line operations, the net gain on the sale of a New York City office
building, changes to management retirement benefit plans, sever-
ance costs, and Verizon Center relocation-related costs. Special and
non-recurring items in 2004 primarily included pension settlement
losses, operating asset losses, and costs associated with the early
retirement of debt, partially offset by an expense credit resulting
from the favorable resolution of pre-bankruptcy amounts due from
MCI as well as a gain on the sale of an investment.
Domestic Wireless
Our Domestic Wireless segment provides wireless voice and data
services and equipment sales across the United States. This seg-
ment primarily represents the operations of the Verizon Wireless joint
venture with Vodafone. Verizon owns a 55% interest in the joint ven-
ture and Vodafone owns the remaining 45%. All financial results
included in the tables below reflect the consolidated results of
Verizon Wireless.
Operating Revenues (dollars in millions)
Years Ended December 31, 2006 2005 2004
Wireless sales and services $38,043 $32,301 $ 27,662
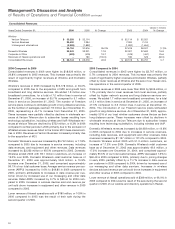
Domestic Wireless’s total revenues of $38,043 million were $5,742
million, or 17.8% higher in 2006 compared to 2005. Service rev-
enues of $32,796 million were $4,665 million, or 16.6% higher than
2005. The service revenue increase was primarily due to a 15.0%
increase in customers as of December 31, 2006 compared to
December 31, 2005, and increased average revenue per customer.
Equipment and other revenue increased $1,077 million, or 25.8% in
2006 compared to 2005 principally as a result of increases in the
number and price of wireless devices sold. Other revenue also
increased due to increases in regulatory fees, primarily the universal
service fund, and cost recovery surcharges.
Our Domestic Wireless segment ended 2006 with 59.1 million cus-
tomers, an increase of 7.7 million net new customers, or 15.0%
compared to December 31, 2005. Substantially all of the net cus-
tomers added during 2006 were retail customers. The overall
composition of our Domestic Wireless customer base as of
December 31, 2006 was 92.6% retail postpaid, 3.6% retail prepaid
and 3.8% resellers. Total average monthly churn, the rate at which
customers disconnect service, decreased to 1.17% in 2006 com-
pared to 1.26% in 2005. Retail postpaid churn decreased to 0.9% in
2006 compared to 1.1% in 2005.
Average revenue per customer per month increased 0.6% to $49.80
in 2006 compared to 2005. Average service revenue per customer
reflected a 72% increase in data revenue per customer in 2006,
compared to 2005, driven by increased use of our messaging,
VZAccess and other data services. Retail service revenue per retail
customer of $50.44 also grew in 2006, compared to 2005. However,
Domestic Wireless continued to experience an increase in the pro-
portion of customers on its Family Share price plans, which put
downward pressure on average service revenue per customer during
Management’s Discussion and Analysis
of Results of Operations and Financial Condition continued