Verizon Wireless 2006 Annual Report Download - page 29
Download and view the complete annual report
Please find page 29 of the 2006 Verizon Wireless annual report below. You can navigate through the pages in the report by either clicking on the pages listed below, or by using the keyword search tool below to find specific information within the annual report.-
 1
1 -
2
-
3
-
4
-
5
-
6
-
7
-
8
-
9
-
10
-
11
-
12
-
13
-
14
-
15
-
16
-
17
-
18
-
 19
19 -
 20
20 -
 21
21 -
 22
22 -
 23
23 -
 24
24 -
 25
25 -
 26
26 -
 27
27 -
 28
28 -
 29
29 -
 30
30 -
 31
31 -
 32
32 -
 33
33 -
 34
34 -
 35
35 -
 36
36 -
 37
37 -
 38
38 -
 39
39 -
40
-
41
-
42
-
43
-
44
-
45
-
46
-
47
-
48
-
49
-
50
-
51
-
52
-
53
-
54
-
55
-
56
-
57
-
58
-
59
-
60
-
61
-
62
-
63
-
64
-
65
-
66
-
67
-
68
-
69
-
70
-
71
-
72
-
73
-
74
-
75
-
76
-
77
-
78
-
79
-
80
-
81
-
82
-
83
-
84
 |
 |

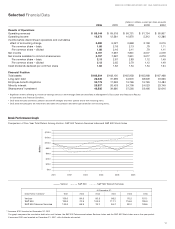
27
2006. Data revenues were $4,475 million and accounted for 13.6%
of service revenue in 2006, compared to $2,243 million and 8.0% of
service revenue in 2005.
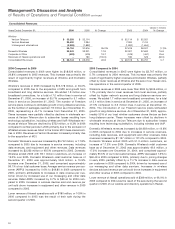
Domestic Wireless’s total revenues of $32,301 million were $4,639
million, or 16.8% higher in 2005 compared to 2004. Service rev-
enues of $28,131 million were $3,731 million, or 15.3% higher than
2004. This revenue growth was primarily due to increased cus-
tomers, partially offset by a decrease in average revenue per
customer per month, and increases in equipment and other revenue,
principally as a result of an increase in wireless devices sold
together with an increase in revenue per unit sold. At December 31,
2005, customers totaled 51.3 million, an increase of 17.2% com-
pared to December 31, 2004. Retail net additions accounted for 7.2
million, or 95.8% of the total net additions. Total churn decreased to
1.3% in 2005, compared to 1.5% in 2004. Retail postpaid churn
decreased to 1.1% in 2005 compared to 1.3% in 2004.
Average revenue per customer per month decreased 1.5% to $49.49
in 2005 compared to 2004, primarily due to pricing changes to our
America’s Choice and Family Share plans earlier in the year. Partially
offsetting the impact of these pricing changes was a 71.7% increase
in data revenue per customer in 2005 compared to 2004, driven by
increased use of our messaging and other data services. Data rev-
enues were $2,243 million and accounted for 8.0% of service
revenue in 2005, compared to $1,116 million and 4.6% of service
revenue in 2004.
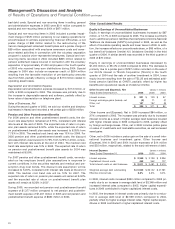
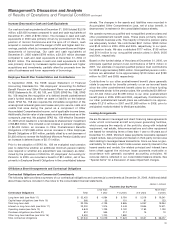
Operating Expenses (dollars in millions)
Years Ended December 31, 2006 2005 2004
Cost of services and sales $11,491 $9,393 $ 7,747
Selling, general and administrative expense 12,039 10,768 9,591
Depreciation and amortization expense 4,913 4,760 4,486
$28,443 $24,921 $ 21,824
Cost of Services and Sales
Cost of services and sales, which are costs to operate the wireless
network as well as the cost of roaming, long distance and equipment
sales, increased by $2,098 million, or 22.3% in 2006 compared to
2005. Cost of services increased due to higher wireless network
costs in 2006 caused by increased network usage relating to both
voice and data services, partially offset by lower rates for long dis-
tance, roaming and local interconnection. Cost of equipment sales
grew by 29.7% in 2006 compared to 2005. The increase was prima-
rily attributed to an increase in wireless devices sold, resulting from
an increase in equipment upgrades and gross retail activations,
together with an increase in cost per unit driven by increased sales of
higher cost advanced wireless devices, in 2006, compared to 2005.
Cost of services and sales increased by $1,646 million, or 21.2% in
2005 compared to 2004. This increase was primarily due to higher
network charges resulting from increased network usage in 2005
compared to 2004, and an increase in cost of equipment sales
driven by increased wireless devices sold and equipment upgrades
in 2005 compared to 2004.
Selling, General and Administrative Expense
Selling, general and administrative expense increased by $1,271 mil-
lion, or 11.8% in 2006 compared to 2005. This increase was
primarily due to an increase in salary and benefits expense of $632
million, resulting from an increase in employees, primarily in the
sales and customer care areas, and higher per employee salary and
benefit costs. Advertising and promotion expense increased $207
million in 2006, compared to 2005. Also contributing to the increase
were higher costs associated with regulatory fees, primarily the uni-
versal service fund, which increased by $167 million in 2006 com-
pared to 2005.
Selling, general and administrative expense increased by $1,177 mil-
lion, or 12.3% in 2005 compared to 2004. This increase was
primarily due to increased salary and benefits expense and higher
sales commissions, related to an increase in customer additions and
renewals during 2005 compared to 2004.
Depreciation and Amortization Expense
Depreciation and amortization expense increased by $153 million, or
3.2% in 2006 compared to 2005 and increased by $274 million, or
6.1% in 2005 compared to 2004. These increases were primarily due
to increased depreciation expense related to the increases in depre-
ciable assets. The increase in 2006 was partially offset by a decrease
in amortization expense due to fully amortized customer lists.
Segment Income (dollars in millions)
Years Ended December 31, 2006 2005 2004
Segment Income $2,976 $2,219 $ 1,645
Segment income increased by $757 million, or 34.1% in 2006 com-
pared to 2005 and increased by $574 million, or 34.9% in 2005
compared to 2004, primarily as a result of the after-tax impact of oper-
ating revenues and operating expenses described above, partially
offset by higher minority interest expense. Special and non-recurring
items of $42 million after-tax were due to the adoption of SFAS 123 (R).
There were no special items affecting this segment in 2005 or 2004.
Increases in minority interest expense in 2006 and 2005 were princi-
pally due to the increased income of the wireless joint venture and
the significant minority interest attributable to Vodafone.
SPECIAL ITEMS
Disposition of Businesses and Investments
Sale of Discontinued Operations
On December 1, 2006, we closed the sale of Verizon Dominicana.
The transaction resulted in net pretax cash proceeds of $2,042 mil-
lion. The U.S. taxes that became payable and were recognized at the
time the transaction closed significantly exceeded the amount of the
pretax gain of $30 million. The sale resulted in an after-tax loss of
$541 million (or $.18 per diluted share). There were no similar items
in 2005. In 2004, we closed on the sale of Verizon Information
Services Canada Inc. and recorded a gain of $1,017 million ($516
million after-tax, or $.18 per diluted share).
Sales of Businesses, Net
During 2005, we sold our wireline and directory businesses in
Hawaii, including Verizon Hawaii Inc. which operated approximately
700,000 switched access lines, as well as the services and assets of
Verizon Long Distance, Verizon Online, Verizon Information Services
and Verizon Select Services Inc. in Hawaii, to an affiliate of The
Carlyle Group for $1,326 million in cash proceeds. In connection
with this sale, we recorded a net pretax gain of $530 million ($336
million after-tax, or $.12 per diluted share). There were no similar
items in 2006 and 2004.
Sales of Investments, Net
During 2004, we recorded a pretax gain of $787 million ($565 million
after-tax, or $.20 per diluted share) on the sale of our 20.5% interest
in TELUS in an underwritten public offering in the U.S. and Canada.
In connection with this sale transaction, Verizon recorded a contri-
bution of $100 million to Verizon Foundation to fund its charitable
Management’s Discussion and Analysis
of Results of Operations and Financial Condition continued