Verizon Wireless 2006 Annual Report Download - page 23
Download and view the complete annual report
Please find page 23 of the 2006 Verizon Wireless annual report below. You can navigate through the pages in the report by either clicking on the pages listed below, or by using the keyword search tool below to find specific information within the annual report.-
 1
1 -
2
-
3
-
4
-
5
-
6
-
7
-
8
-
9
-
10
-
11
-
12
-
 13
13 -
 14
14 -
 15
15 -
 16
16 -
 17
17 -
 18
18 -
 19
19 -
 20
20 -
 21
21 -
 22
22 -
 23
23 -
 24
24 -
 25
25 -
 26
26 -
 27
27 -
 28
28 -
 29
29 -
 30
30 -
 31
31 -
 32
32 -
 33
33 -
34
-
35
-
36
-
37
-
38
-
39
-
40
-
41
-
42
-
43
-
44
-
45
-
46
-
47
-
48
-
49
-
50
-
51
-
52
-
53
-
54
-
55
-
56
-
57
-
58
-
59
-
60
-
61
-
62
-
63
-
64
-
65
-
66
-
67
-
68
-
69
-
70
-
71
-
72
-
73
-
74
-
75
-
76
-
77
-
78
-
79
-
80
-
81
-
82
-
83
-
84
 |
 |

costs related to re-branding initiatives and systems integration activ-
ities, and a net pretax charge of $184 million for Verizon Center
relocation costs. Special and non-recurring items in 2005 included a
pretax impairment charge of $125 million pertaining to our leasing
operations for aircraft leased to airlines experiencing financial difficul-
ties, a net pretax charge of $98 million related to the restructuring of
the Verizon management retirement benefit plans and a pretax charge
of $59 million associated with employee severance costs and sever-
ance-related activities in connection with the voluntary separation
program for surplus union-represented employees.
Depreciation and Amortization Expense
Depreciation and amortization expense increased by $930 million, or
6.8% in 2006 compared to 2005. This increase was primarily due to
higher depreciable and amortizable asset bases as a result of the
MCI merger and, to a lesser extent, increased capital expenditures.
2005 Compared to 2004
Cost of Services and Sales
Cost of services and sales increased by $2,168 million, or 9.8% in
2005 compared to 2004. This increase was principally due to
increases in pension and other postretirement benefit costs, higher
direct wireless network costs, increases in wireless equipment costs
and higher costs associated with our wireline growth businesses.
The overall impact of pension and other postretirement benefit plan
assumption changes, combined with lower asset returns over the
last several years, increased net pension and postretirement benefit
expenses by $407 million in 2005 (primarily in cost of services and
sales) compared to 2004. Higher direct wireless network charges
resulted from increased network usage in 2005 compared to 2004,
partially offset by lower roaming, local interconnection and long dis-
tance rates. Cost of equipment sales was higher in 2005 due
primarily to an increase in wireless devices sold together with an
increase in cost per unit sold, driven by growth in customer addi-
tions and an increase in equipment upgrades in 2005. Higher costs
associated with our wireline growth businesses, long distance and
broadband connections, included a 2,400, or 1.7% increase in the
number of Wireline employees as of December 31, 2005 compared
to December 31, 2004. Costs in 2004 were impacted by lower inter-
connection expense charged by competitive local exchange carriers
(CLECs) and settlements with carriers, including the MCI settlement
recorded in 2004.
Selling, General and Administrative Expense
Selling, general and administrative expense increased by $306 million,
or 1.6% in 2005 compared to 2004. This increase was driven by
increases in salary, pension and benefits costs, including an increase
in the customer care and sales channel work force and sales commis-
sions, partially offset by gains on real estate sales in 2005 and lower
2006 Compared to 2005
Cost of Services and Sales
Cost of services and sales increased by $10,794 million, or 44.6% in
2006 compared to 2005. This increase was driven by the inclusion of
the former MCI operations, higher wireless network costs, increases
in wireless equipment costs and increases in pension and other
postretirement benefit costs, partially offset by the net impact of
productivity improvement initiatives.
The higher wireless network costs were caused by increased network
usage relating to both voice and data services in 2006 compared to
2005, partially offset by decreased roaming, local interconnection
and long distance rates. Cost of wireless equipment sales increased
in 2006 compared to 2005 primarily as a result of an increase in wire-
less devices sold due to an increase in gross activations and
equipment upgrades, together with an increase in cost per unit.
Costs in these periods were also impacted by increased pension and
other postretirement benefit costs. The overall impact of the 2006
assumptions, combined with the impact of lower than expected actual
asset returns over the past several years, resulted in pension and
other postretirement benefit expense of approximately $1,377 million
in 2006 compared to net pension and postretirement benefit expense
of $1,231 million in 2005. Special and non-recurring items recorded
during 2006 included $25 million of merger integration costs.
Selling, General and Administrative Expense
Selling, general and administrative expense includes salaries and
wages and benefits not directly attributable to a service or product,
bad debt charges, taxes other than income, advertising and
sales commission costs, customer billing, call center and informa-
tion technology costs, professional service fees and rent for
administrative space.
Selling, general and administrative expense increased by $5,580 mil-
lion, or 28.4% in 2006 compared to 2005. This increase was driven
by the inclusion of the former MCI operations, increases in the
Domestic Wireless segment primarily related to increased salary and
benefits expenses, and special and non-recurring charges. Special
and non-recurring items in selling, general and administrative
expenses in 2006 were $816 million compared to special and non-
recurring items in 2005 of $311 million.
Special and non-recurring items in 2006 included $56 million related
to pension settlement losses incurred in connection with our benefit
plans, a net pretax charge of $369 million for employee severance
and severance-related activities in connection with the involuntary
separation of approximately 4,100 employees, who were separated in
2006. Special and non-recurring charges in 2006 also included $207
million of merger integration costs, primarily for advertising and other
21
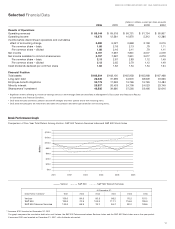
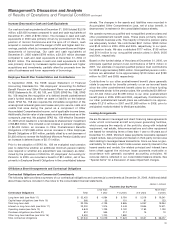
Consolidated Operating Expenses
(dollars in millions)
Years Ended December 31, 2006 2005 % Change 2005 2004 % Change
Cost of services and sales $34,994 $24,200 44.6% $ 24,200 $ 22,032 9.8%
Selling, general and administrative expense 25,232 19,652 28.4 19,652 19,346 1.6
Depreciation and amortization expense 14,545 13,615 6.8 13,615 13,503 0.8
Sales of businesses, net –(530) (100.0) (530) – nm
Consolidated Operating Expenses $74,771 $56,937 31.3 $ 56,937 $ 54,881 3.7
nm – Not meaningful
Management’s Discussion and Analysis
of Results of Operations and Financial Condition continued