Verizon Wireless 2006 Annual Report Download - page 59
Download and view the complete annual report
Please find page 59 of the 2006 Verizon Wireless annual report below. You can navigate through the pages in the report by either clicking on the pages listed below, or by using the keyword search tool below to find specific information within the annual report.-
 1
1 -
2
-
3
-
4
-
5
-
6
-
7
-
8
-
9
-
10
-
11
-
12
-
13
-
14
-
15
-
16
-
17
-
18
-
19
-
20
-
21
-
22
-
23
-
24
-
25
-
26
-
27
-
28
-
29
-
30
-
31
-
32
-
33
-
34
-
35
-
36
-
37
-
38
-
39
-
40
-
41
-
42
-
43
-
44
-
45
-
46
-
47
-
48
-
 49
49 -
 50
50 -
 51
51 -
 52
52 -
 53
53 -
 54
54 -
 55
55 -
 56
56 -
 57
57 -
 58
58 -
 59
59 -
 60
60 -
 61
61 -
 62
62 -
 63
63 -
 64
64 -
 65
65 -
 66
66 -
 67
67 -
 68
68 -
 69
69 -
70
-
71
-
72
-
73
-
74
-
75
-
76
-
77
-
78
-
79
-
80
-
81
-
82
-
83
-
84
 |
 |

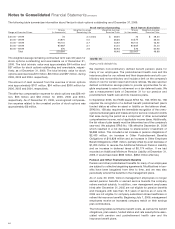
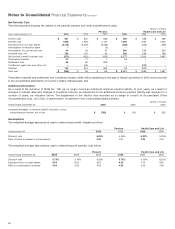
Notes to Consolidated Financial Statements continued
57
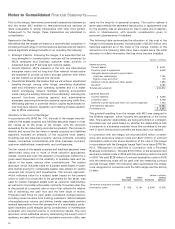
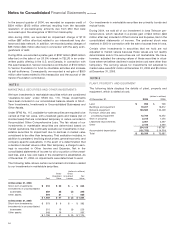
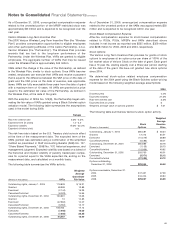
The following table is a summary of the components of income from
leveraged leases:
(dollars in millions)
Years Ended December 31, 2006 2005 2004
Pretax lease income $96 $119 $ 63
Income tax expense/(benefit) 57 (25) (52)
Investment tax credits 443
The future minimum lease payments to be received from noncance-
lable leases, net of nonrecourse loan payments related to leveraged
and direct financing leases in excess of debt service requirements,
for the periods shown at December 31, 2006, are as follows:
(dollars in millions)
Capital Operating
Years Leases Leases
2007 $ 128 $ 32
2008 92 18
2009 153 14
2010 132 11
2011 114 8
Thereafter 2,820 24
Total $ 3,439 $ 107
As Lessee
We lease certain facilities and equipment for use in our operations
under both capital and operating leases. Total rent expense from
continuing operations under operating leases amounted to $1,608
million in 2006, $1,458 million in 2005 and $1,278 million in 2004.
Capital lease amounts included in plant, property and equipment
are as follows:
(dollars in millions)
At December 31, 2006 2005
Capital leases $359 $313
Accumulated amortization (160) (137)
Total $199 $176
The aggregate minimum rental commitments under noncancelable
leases for the periods shown at December 31, 2006, are as follows:
(dollars in millions)
Capital Operating
Years Leases Leases
2007 $ 80 $ 1,739
2008 69 1,194
2009 64 998
2010 55 724
2011 51 459
Thereafter 161 1,729
Total minimum rental commitments 480 $ 6,843
Less interest and executory costs (120)
Present value of minimum lease payments 360
Less current installments (55)
Long-term obligation at December 31, 2006 $ 305
As of December 31, 2006, the total minimum sublease rentals to be
received in the future under noncancelable operating and capital
subleases were $124 million and $0.9 million, respectively.
Finance lease receivables, which are included in Prepaid Expenses and Other and Other Assets in our consolidated balance sheets are
comprised of the following:
(dollars in millions)
At December 31, 2006 2005
Direct Direct
Leveraged Finance Leveraged Finance
Leases Leases Total Leases Leases Total
Minimum lease payments receivable $3,311 $ 128 $ 3,439 $3,847 $ 123 $ 3,970
Estimated residual value 1,637 18 1,655 1,937 9 1,946
Unearned income (1,895) (22) (1,917) (2,260) (11) (2,271)
$3,053 $ 124 3,177 $3,524 $ 121 3,645
Allowance for doubtful accounts (175) (375)
Finance lease receivables, net $3,002 $3,270
Current $40 $30
Noncurrent $2,962 $3,240
Accumulated deferred taxes arising from leveraged leases, which are included in Deferred Income Taxes, amounted to $2,674 million at
December 31, 2006 and $3,049 million at December 31, 2005.