Verizon Wireless 2006 Annual Report Download - page 27
Download and view the complete annual report
Please find page 27 of the 2006 Verizon Wireless annual report below. You can navigate through the pages in the report by either clicking on the pages listed below, or by using the keyword search tool below to find specific information within the annual report.-
 1
1 -
2
-
3
-
4
-
5
-
6
-
7
-
8
-
9
-
10
-
11
-
12
-
13
-
14
-
15
-
16
-
 17
17 -
 18
18 -
 19
19 -
 20
20 -
 21
21 -
 22
22 -
 23
23 -
 24
24 -
 25
25 -
 26
26 -
 27
27 -
 28
28 -
 29
29 -
 30
30 -
 31
31 -
 32
32 -
 33
33 -
 34
34 -
 35
35 -
 36
36 -
 37
37 -
38
-
39
-
40
-
41
-
42
-
43
-
44
-
45
-
46
-
47
-
48
-
49
-
50
-
51
-
52
-
53
-
54
-
55
-
56
-
57
-
58
-
59
-
60
-
61
-
62
-
63
-
64
-
65
-
66
-
67
-
68
-
69
-
70
-
71
-
72
-
73
-
74
-
75
-
76
-
77
-
78
-
79
-
80
-
81
-
82
-
83
-
84
 |
 |

25
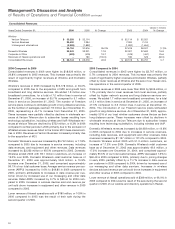
Wholesale revenues decreased by $752 million, or 8.3% in 2006 and
by $53 million, or 0.6% in 2005, due to the exclusion, in 2006, of
affiliated access revenues billed to the former MCI mass market
entities, and, in 2006 and 2005, to declines in legacy Verizon
switched access revenues and local wholesale revenues, offset by
increases in special access revenues.
Switched minutes of use declined in 2006 and 2005, reflecting the
impact of access line loss and technology substitution. Wholesale lines
decreased by 17.1% in 2006 due to the impact of a decision by a
major competitor to deemphasize their local market initiatives in 2005.
Special access revenue growth reflects continuing demand in the busi-
ness market for high-capacity, high-speed digital services, partially
offset by lessening demand for older, low-speed data products and
services. As of December 31, 2006, customer demand for high
capacity and digital data services increased 8.9% compared to 2005.
The FCC regulates the rates that we charge customers for interstate
access services. See “Other Factors That May Affect Future Results
– Regulatory and Competitive Trends – FCC Regulation” for addi-
tional information on FCC rulemaking concerning federal access
rates, universal service and certain broadband services.
Other
Other revenues include services such as operator services (including
deaf relay services), public (coin) telephone, card services and supply
sales, as well as former MCI dial-around services including 10-10-
987, 10-10-220, 1-800-COLLECT and Prepaid Cards.
Verizon Telecom’s revenues from other services decreased by $185
million, or 7.1% in 2006, and by $93 million, or 3.5% in 2005. These
revenue decreases were mainly due to the discontinuation of non-
strategic businesses, including the termination of a large commercial
inventory management contract in 2005, and reduced business vol-
umes, which were partially offset by the inclusion of revenues from
the former MCI in 2006.
Verizon Business
Enterprise Business
Our Enterprise Business market provides voice, data and internet
communications services to medium and large business customers,
multi-national corporations, and state and federal government cus-
tomers. In addition, the Enterprise Business market also provides
value-added services that make communications more secure, reli-
able and efficient managed network services for customers that
outsource all or portions of their communications and information
processing operations. Traditional local and long distance services
comprise $6,551 million, or 47% of revenue in 2006, $4,110 million,
or 68% of revenue in 2005, and $4,447 million, or 72% of total
Enterprise Business revenue in 2004. Enterprise Business also pro-
vides data services such as Private Line, Frame Relay and ATM
services, both domestically and internationally, as well as managed
network services to its customers.
Enterprise Business 2006 revenues of $13,999 million, increased
$7,981 million, or 132.6% compared to 2005 primarily due to the
acquisition of MCI, and declined $178 million, or 2.9% in 2005 com-
pared to 2004. Data services revenue was $5,430, or 39% of
Enterprise Business’ revenue stream in 2006, $1,908 million, or 32%
in 2005, and $1,749 million, or 28% in 2004. Internet services rev-
enue was $2,018 million in 2006, or 14% of Enterprise Business’s
revenues, the first year Enterprise Business offered Internet services.
The Internet suite of products is Enterprise Business’ fastest
growing and includes Private IP, IP VPN, Web Hosting and VoIP.
Enterprise Business 2005 revenues of $6,018 million declined $178
million compared to 2004, primarily due to a 3.5% decline in busi-
ness access lines, reflecting competition and a shift to high-speed,
high volume special access lines.
Wholesale
Our Wholesale revenues relate to domestic wholesale services,
which include all wholesale traffic sold in the United States, as well
as international traffic that originates in the United States.
In the year ended December 31, 2006, our Verizon Business
Wholesale revenues of $3,381 million, increased $2,005 million, or
145.7%, compared to 2005, primarily due to the MCI acquisition.
Local and long distance voice products, including transport, repre-
sented $1,601 million or 47% of the market’s total revenue in 2006,
the first year the Wholesale business group has offered voice prod-
ucts. Wholesale revenue is influenced by aggressive competitive
pricing, in particular long distance voice services. Wholesale data
and Internet revenues were $1,780 million, or 52% of total
Wholesale revenue for the year ended December 31, 2006, $1,376
million, or 100% of total Wholesale revenue in 2005 and $1,218 mil-
lion, or 100% of total Wholesale revenues in 2004.
International and Other
Our International operations serve businesses, government entities
and telecommunication carriers outside of the United States. Other
operations include our Skytel paging business.
Our revenues from International and Other in the year ended
December 31, 2006 were $3,110 million. This market represents a
new revenue stream to Verizon resulting from the MCI acquisition.
International and Other had voice revenue of $1,822 million in the
year ended December 31, 2006, or 58% of the total International
and Other revenues. Internet revenue represented $894 million, or
29% of total revenue in the period. Data revenue was $394 million,
or 13% of total International and Other revenue in the year ended
December 31, 2006.
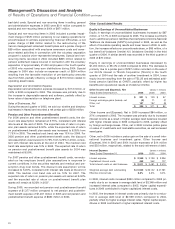
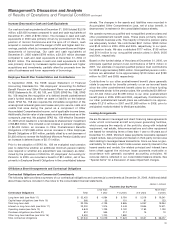
Operating Expenses (dollars in millions)
Years Ended December 31, 2006 2005 2004
Cost of services and sales $24,522 $15,604 $ 14,830
Selling, general and administrative expense 12,116 8,419 8,621
Depreciation and amortization expense 9,590 8,801 8,910
$46,228 $32,824 $ 32,361
Cost of Services and Sales
Cost of services and sales includes the following costs directly
attributable to a service or product: salaries and wages, benefits,
materials and supplies, contracted services, network access and
transport costs, customer provisioning costs, computer systems
support, costs to support our outsourcing contracts and technical
facilities, contributions to the universal service fund, customer provi-
sioning costs and cost of products sold. Aggregate customer care
costs, which include billing and service provisioning, are allocated
between cost of services and sales and selling, general and admin-
istrative expense.
Cost of services and sales increased by $8,918 million, or 57.2% in
2006 compared to 2005. These increases were primarily due to the
MCI merger in 2006 partially offset by the net impact of other cost
changes. Higher costs associated with our growth businesses and
annual wage increases were partially offset by productivity improve-
ment initiatives, which reduced cost of services and sales expenses
in 2006. Expenses were also impacted by increased net pension and
other postretirement benefit costs. The overall impact of the 2006
Management’s Discussion and Analysis
of Results of Operations and Financial Condition continued