Verizon Wireless 2006 Annual Report Download - page 2
Download and view the complete annual report
Please find page 2 of the 2006 Verizon Wireless annual report below. You can navigate through the pages in the report by either clicking on the pages listed below, or by using the keyword search tool below to find specific information within the annual report.-
 1
1 -
 2
2 -
 3
3 -
 4
4 -
 5
5 -
 6
6 -
 7
7 -
 8
8 -
 9
9 -
 10
10 -
 11
11 -
 12
12 -
 13
13 -
14
-
15
-
16
-
17
-
18
-
19
-
20
-
21
-
22
-
23
-
24
-
25
-
26
-
27
-
28
-
29
-
30
-
31
-
32
-
33
-
34
-
35
-
36
-
37
-
38
-
39
-
40
-
41
-
42
-
43
-
44
-
45
-
46
-
47
-
48
-
49
-
50
-
51
-
52
-
53
-
54
-
55
-
56
-
57
-
58
-
59
-
60
-
61
-
62
-
63
-
64
-
65
-
66
-
67
-
68
-
69
-
70
-
71
-
72
-
73
-
74
-
75
-
76
-
77
-
78
-
79
-
80
-
81
-
82
-
83
-
84
 |
 |

Note: Prior-period amounts have been reclassified to reflect comparable results. See www.verizon.com/investor for reconciliations to generally accepted accounting principles
(GAAP) for the non-GAAP financial measures included in this annual report. Verizon’s 2006 reported results include revenues and expenses from the former MCI, Inc., subsequent
to the close of the merger in January 2006. Information provided in this annual report on a pro-forma (non-GAAP) basis presents the combined operating results of Verizon and
the former MCI on a comparable basis. Discontinued operations include Verizon’s former directory publishing unit, which was spun-off to shareholders in the fourth quarter 2006,
and the operations of Verizon Dominicana C. por A. and Telecomunicaciones de Puerto Rico Inc. following second quarter 2006 agreements to sell the businesses. The Verizon
Dominicana sale closed in the fourth quarter 2006. Intra- and inter-segment transactions have not been eliminated from the business group revenue totals cited above.
In keeping with Verizon’s commitment to protecting the environment, this annual report is printed on recycled paper.
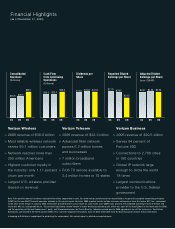
Verizon Wireless
> 2006 revenue of $38.0 billion
> Most reliable wireless network
serves 59.1 million customers
> Network reaches more than
255 million Americans
> Highest customer loyalty in
the industry: only 1.17 percent
churn per month
> Largest U.S. wireless provider
(based on revenue)
Verizon Telecom
> 2006 revenue of $33.3 billion
> Advanced fiber network
passes 6.2 million homes
and businesses
> 7 million broadband
subscribers
> FiOS TV service available to
2.4 million homes in 10 states
Verizon Business
> 2006 revenue of $20.5 billion
> Serves 94 percent of
Fortune 500
> Connections to 2,700 cities
in 150 countries
> Global IP network large
enough to circle the world
18 times
> Largest communications
provider to the U.S. federal
government
Consolidated
Revenues
(billions)
04 05 06
Cash Flow
from Continuing
Operations
(billions)
04 05 06
Dividends per
Share
04 05 06
$65.8 $69.5
$88.1
$20.2 $20.4
$23.0 $1.54 $1.62 $1.62
Adjusted Diluted
Earnings per Share
(non-GAAP)
04 05 06
$2.51 $2.56 $2.54
04 05 06
$2.79 $2.65
$2.12
Reported Diluted
Earnings per Share
Financial Highlights
(as of December 31, 2006)