Verizon Wireless 2006 Annual Report Download - page 73
Download and view the complete annual report
Please find page 73 of the 2006 Verizon Wireless annual report below. You can navigate through the pages in the report by either clicking on the pages listed below, or by using the keyword search tool below to find specific information within the annual report.-
 1
1 -
2
-
3
-
4
-
5
-
6
-
7
-
8
-
9
-
10
-
11
-
12
-
13
-
14
-
15
-
16
-
17
-
18
-
19
-
20
-
21
-
22
-
23
-
24
-
25
-
26
-
27
-
28
-
29
-
30
-
31
-
32
-
33
-
34
-
35
-
36
-
37
-
38
-
39
-
40
-
41
-
42
-
43
-
44
-
45
-
46
-
47
-
48
-
49
-
50
-
51
-
52
-
53
-
54
-
55
-
56
-
57
-
58
-
59
-
60
-
61
-
62
-
 63
63 -
 64
64 -
 65
65 -
 66
66 -
 67
67 -
 68
68 -
 69
69 -
 70
70 -
 71
71 -
 72
72 -
 73
73 -
 74
74 -
 75
75 -
 76
76 -
 77
77 -
 78
78 -
 79
79 -
 80
80 -
 81
81 -
 82
82 -
 83
83 -
84
 |
 |

Notes to Consolidated Financial Statements continued
71
Financial information for Wireline excludes the effects of Hawaii
access lines and directory operations sold in 2005.
We generally account for intersegment sales of products and serv-
ices and asset transfers at current market prices. We are not
dependent on any single customer.
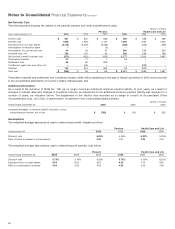
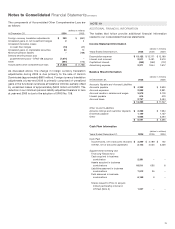
Geographic Areas
Our foreign investments are located principally in the Americas and
Europe. Domestic and foreign operating revenues are based on the
location of customers. Long-lived assets consist of plant, property
and equipment (net of accumulated depreciation) and investments
in unconsolidated businesses. The table below presents financial
information by major geographic area:
(dollars in millions)
Years Ended December 31, 2006 2005 2004
Domestic
Operating revenues $84,693 $69,327 $ 65,659
Long-lived assets 82,277 74,813 72,488
Foreign
Operating revenues 3,451 191 92
Long-lived assets 4,947 2,776 4,973
Consolidated
Operating revenues 88,144 69,518 65,751
Long-lived assets 87,224 77,589 77,461
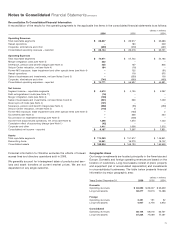
Reconciliation To Consolidated Financial Information
A reconciliation of the results for the operating segments to the applicable line items in the consolidated financial statements is as follows:
(dollars in millions)
2006 2005 2004
Operating Revenues
Total reportable segments $88,837 $69,917 $ 65,683
Hawaii operations –180 529
Corporate, eliminations and other (693) (579) (461)
Consolidated operating revenues – reported $88,144 $69,518 $ 65,751
Operating Expenses
Total reportable segments $74,671 $57,745 $ 54,185
Merger integration costs (see Note 4) 232 ––
Severance, pension and benefit charges (see Note 4) 425 157 805
Verizon Center relocation, net (see Note 4) 184 (18) –
Former MCI exposure, lease impairment and other special items (see Note 4) –125 (91)
Hawaii operations –118 375
Sales of businesses and investments, net (see Notes 3 and 5) –(530) 100
Corporate, eliminations and other (741) (660) (493)
Consolidated operating expenses – reported $74,771 $56,937 $ 54,881
Net Income
Segment income – reportable segments $4,610 $4,125 $ 4,297
Debt extinguishment costs (see Note 11) (16) ––
Merger integration costs (see Note 4) (146) ––
Sales of businesses and investments, net (see Notes 3 and 5) (541) 336 1,059
Idearc spin-off costs (see Note 4) (101) ––
Severance, pension and benefit charges (see Note 4) (258) (95) (499)
Verizon Center relocation, net (see Note 4) (118) 8–
Former MCI exposure, lease impairment and other special items (see Note 4) –(133) 2
Tax benefits (see Note 4) –336 234
Tax provision on repatriated earnings (see Note 4) –(206) –
Income from discontinued operations, net of tax (see Note 3) 1,398 1,370 1,423
Cumulative effect of accounting change (see Note 1) (42) ––
Corporate and other 1,411 1,656 1,315
Consolidated net income – reported $6,197 $7,397 $ 7,831
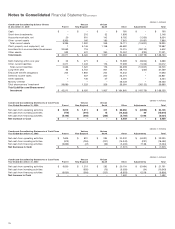
Assets
Total reportable segments $174,263 $151,917 $ 146,851
Reconciling items 14,541 16,213 19,107
Consolidated assets $188,804 $168,130 $ 165,958