Verizon Wireless 2006 Annual Report Download - page 68
Download and view the complete annual report
Please find page 68 of the 2006 Verizon Wireless annual report below. You can navigate through the pages in the report by either clicking on the pages listed below, or by using the keyword search tool below to find specific information within the annual report.-
 1
1 -
2
-
3
-
4
-
5
-
6
-
7
-
8
-
9
-
10
-
11
-
12
-
13
-
14
-
15
-
16
-
17
-
18
-
19
-
20
-
21
-
22
-
23
-
24
-
25
-
26
-
27
-
28
-
29
-
30
-
31
-
32
-
33
-
34
-
35
-
36
-
37
-
38
-
39
-
40
-
41
-
42
-
43
-
44
-
45
-
46
-
47
-
48
-
49
-
50
-
51
-
52
-
53
-
54
-
55
-
56
-
57
-
 58
58 -
 59
59 -
 60
60 -
 61
61 -
 62
62 -
 63
63 -
 64
64 -
 65
65 -
 66
66 -
 67
67 -
 68
68 -
 69
69 -
 70
70 -
 71
71 -
 72
72 -
 73
73 -
 74
74 -
 75
75 -
 76
76 -
 77
77 -
 78
78 -
79
-
80
-
81
-
82
-
83
-
84
 |
 |

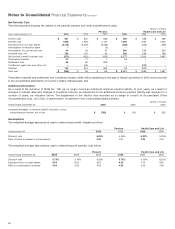
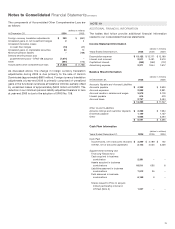
Net Periodic Cost
The following table displays the details of net periodic pension and other postretirement costs:
(dollars in millions)
Pension Health Care and Life
Years Ended December 31, 2006 2005 2004 2006 2005 2004
Service cost $581 $675 $ 666 $356 $358 $ 269
Interest cost 1,995 1,959 2,144 1,499 1,467 1,422
Expected return on plan assets (3,173) (3,231) (3,565) (328) (349) (409)
Amortization of transition asset ––(4)–––
Amortization of prior service cost 44 42 57 360 290 236
Actuarial loss, net 182 124 45 290 258 169
Net periodic benefit (income) cost (371) (431) (657) 2,177 2,024 1,687
Termination benefits 47 11 1 14 1–
Settlement loss 56 80 805 –––
Curtailment (gain) loss and other, net –436 – –(332) –
Subtotal 103 527 806 14 (331) –
Total cost $(268) $96 $149 $2,191 $1,693 $ 1,687
Termination benefits and settlement and curtailment losses of $94 million pertaining to the sale of Hawaii operations in 2005 were recorded
in the consolidated statements of income in Sales of Businesses, Net.
Additional Information
As a result of the adoption of SFAS No. 158, we no longer record an additional minimum pension liability. In prior years, as a result of
changes in interest rates and changes in investment returns, an adjustment to the additional minimum pension liability was required for a
number of plans, as indicated below. The adjustment in the liability was recorded as a charge or (credit) to Accumulated Other
Comprehensive Loss, net of tax, in shareowners’ investment in the consolidated balance sheets.
(dollars in millions)
Years Ended December 31, 2006 2005 2004
Increase (decrease) in minimum liability included in other
comprehensive income, net of tax $(788) $(51) $ 332
Assumptions
The weighted-average assumptions used in determining benefit obligations follow:
Pension Health Care and Life
At December 31, 2006 2005 2006 2005
Discount rate 6.00% 5.75% 6.00% 5.75%
Rate of future increases in compensation 4.00 4.00 4.00 4.00
The weighted-average assumptions used in determining net periodic cost follow:
Pension Health Care and Life
Years Ended December 31, 2006 2005 2004 2006 2005 2004
Discount rate 5.75% 5.75% 6.25% 5.75% 5.75% 6.25%
Expected return on plan assets 8.50 8.50 8.50 8.25 7.75 8.50
Rate of compensation increase 4.00 5.00 5.00 4.00 4.00 4.00
66
Notes to Consolidated Financial Statements continued