Verizon Wireless 2006 Annual Report Download - page 72
Download and view the complete annual report
Please find page 72 of the 2006 Verizon Wireless annual report below. You can navigate through the pages in the report by either clicking on the pages listed below, or by using the keyword search tool below to find specific information within the annual report.-
 1
1 -
2
-
3
-
4
-
5
-
6
-
7
-
8
-
9
-
10
-
11
-
12
-
13
-
14
-
15
-
16
-
17
-
18
-
19
-
20
-
21
-
22
-
23
-
24
-
25
-
26
-
27
-
28
-
29
-
30
-
31
-
32
-
33
-
34
-
35
-
36
-
37
-
38
-
39
-
40
-
41
-
42
-
43
-
44
-
45
-
46
-
47
-
48
-
49
-
50
-
51
-
52
-
53
-
54
-
55
-
56
-
57
-
58
-
59
-
60
-
61
-
 62
62 -
 63
63 -
 64
64 -
 65
65 -
 66
66 -
 67
67 -
 68
68 -
 69
69 -
 70
70 -
 71
71 -
 72
72 -
 73
73 -
 74
74 -
 75
75 -
 76
76 -
 77
77 -
 78
78 -
 79
79 -
 80
80 -
 81
81 -
 82
82 -
83
-
84
 |
 |

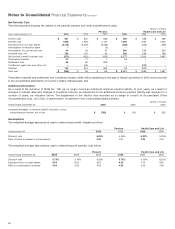
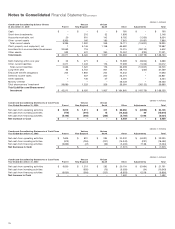
The following table provides operating financial information for our two reportable segments:
(dollars in millions)
2006 Wireline Domestic Wireless Total Segments
External revenues $49,621 $ 37,930 $ 87,551
Intersegment revenues 1,173 113 1,286
Total operating revenues 50,794 38,043 88,837
Cost of services and sales 24,522 11,491 36,013
Selling, general & administrative expense 12,116 12,039 24,155
Depreciation & amortization expense 9,590 4,913 14,503
Total operating expenses 46,228 28,443 74,671
Operating income 4,566 9,600 14,166
Equity in earnings of unconsolidated businesses –1919
Other income and (expense), net 250 4 254
Interest expense (2,062) (452) (2,514)
Minority interest –(4,038) (4,038)
Provision for income taxes (1,120) (2,157) (3,277)
Segment income $1,634 $2,976 $ 4,610
Assets $92,274 $ 81,989 $ 174,263
Investments in unconsolidated businesses 28 87 115
Plant, property and equipment, net 57,031 24,659 81,690
Capital expenditures 10,259 6,618 16,877
2005
External revenues $ 36,628 $ 32,219 $ 68,847
Intersegment revenues 988 82 1,070
Total operating revenues 37,616 32,301 69,917
Cost of services and sales 15,604 9,393 24,997
Selling, general & administrative expense 8,419 10,768 19,187
Depreciation & amortization expense 8,801 4,760 13,561
Total operating expenses 32,824 24,921 57,745
Operating income 4,792 7,380 12,172
Equity in earnings of unconsolidated businesses – 27 27
Other income and (expense), net 79 6 85
Interest expense (1,701) (601) (2,302)
Minority interest –(2,995) (2,995)
Provision for income taxes (1,264) (1,598) (2,862)
Segment income $ 1,906 $ 2,219 $ 4,125
Assets $75,188 $ 76,729 $ 151,917
Investments in unconsolidated businesses 2 154 156
Plant, property and equipment, net 49,618 22,790 72,408
Capital expenditures 8,267 6,484 14,751
2004
External revenues $ 37,160 $ 27,586 $ 64,746
Intersegment revenues 861 76 937
Total operating revenues 38,021 27,662 65,683
Cost of services and sales 14,830 7,747 22,577
Selling, general & administrative expense 8,621 9,591 18,212
Depreciation & amortization expense 8,910 4,486 13,396
Total operating expenses 32,361 21,824 54,185
Operating income 5,660 5,838 11,498
Equity in earnings of unconsolidated businesses – 45 45
Other income and (expense), net 100 11 111
Interest expense (1,602) (661) (2,263)
Minority interest –(2,323) (2,323)
Provision for income taxes (1,506) (1,265) (2,771)
Segment income $ 2,652 $ 1,645 $ 4,297
Assets $78,824 $ 68,027 $ 146,851
Investments in unconsolidated businesses 3 148 151
Plant, property and equipment, net 50,608 20,516 71,124
Capital expenditures 7,118 5,633 12,751
70
Notes to Consolidated Financial Statements continued