Verizon Wireless 2006 Annual Report Download - page 56
Download and view the complete annual report
Please find page 56 of the 2006 Verizon Wireless annual report below. You can navigate through the pages in the report by either clicking on the pages listed below, or by using the keyword search tool below to find specific information within the annual report.-
 1
1 -
2
-
3
-
4
-
5
-
6
-
7
-
8
-
9
-
10
-
11
-
12
-
13
-
14
-
15
-
16
-
17
-
18
-
19
-
20
-
21
-
22
-
23
-
24
-
25
-
26
-
27
-
28
-
29
-
30
-
31
-
32
-
33
-
34
-
35
-
36
-
37
-
38
-
39
-
40
-
41
-
42
-
43
-
44
-
45
-
 46
46 -
 47
47 -
 48
48 -
 49
49 -
 50
50 -
 51
51 -
 52
52 -
 53
53 -
 54
54 -
 55
55 -
 56
56 -
 57
57 -
 58
58 -
 59
59 -
 60
60 -
 61
61 -
 62
62 -
 63
63 -
 64
64 -
 65
65 -
 66
66 -
67
-
68
-
69
-
70
-
71
-
72
-
73
-
74
-
75
-
76
-
77
-
78
-
79
-
80
-
81
-
82
-
83
-
84
 |
 |

Notes to Consolidated Financial Statements continued
54
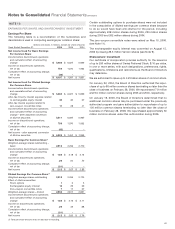
In the second quarter of 2004, we recorded an expense credit of
$204 million ($123 million after-tax) resulting from the favorable
resolution of pre-bankruptcy amounts due from MCI that were
recovered upon the emergence of MCI from bankruptcy.
Also during 2004, we recorded an impairment charge of $113
million ($87 million after-tax) related to our international long dis-
tance and data network. In addition, we recorded pretax charges of
$55 million ($34 million after-tax) in connection with the early extin-
guishment of debt.
During 2004, we recorded a pretax gain of $787 million ($565 million
after-tax) on the sale of our 20.5% interest in TELUS in an under-
written public offering in the U.S. and Canada. In connection with
this sale transaction, Verizon recorded a contribution of $100 million
to Verizon Foundation to fund its charitable activities and increase
its self-sufficiency. Consequently, we recorded a net gain of $500
million after taxes related to this transaction and the accrual of the
Verizon Foundation contribution.
NOTE 5
MARKETABLE SECURITIES AND OTHER INVESTMENTS
We have investments in marketable securities which are considered
“available-for-sale” under SFAS No. 115. These investments
have been included in our consolidated balance sheets in Short-
Term Investments, Investments in Unconsolidated Businesses and
Other Assets.
Under SFAS No. 115, available-for-sale securities are required to be
carried at their fair value, with unrealized gains and losses (net of
income taxes) that are considered temporary in nature recorded in
Accumulated Other Comprehensive Loss. The fair values of our
investments in marketable securities are determined based on
market quotations. We continually evaluate our investments in mar-
ketable securities for impairment due to declines in market value
considered to be other than temporary. That evaluation includes, in
addition to persistent, declining stock prices, general economic and
company-specific evaluations. In the event of a determination that
a decline in market value is other than temporary, a charge to earn-
ings is recorded in Other Income and Expense, Net in the
consolidated statements of income for all or a portion of the unreal-
ized loss, and a new cost basis in the investment is established. As
of December 31, 2006, no impairments were determined to exist.
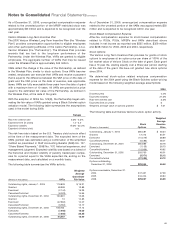
The following table shows certain summarized information related
to our investments in marketable securities:
(dollars in millions)
Gross Gross
Unrealized Unrealized Fair
Cost Gains Losses Value
At December 31, 2006
Short-term investments $616 $ 28 $ – $ 644
Investments in unconsolidated
businesses 259 38 (2) 295
Other assets 594 31 – 625
$1,469 $ 97 $ (2) $ 1,564
At December 31, 2005
Short-term investments $ 373 $ 9 $ – $ 382
Investments in unconsolidated
businesses 215 13 (3) 225
Other assets 548 19 – 567
$1,136 $ 41 $ (3) $ 1,174
Our investments in marketable securities are primarily bonds and
mutual funds.
During 2004, we sold all of our investment in Iowa Telecom pre-
ferred stock, which resulted in a pretax gain of $43 million ($43
million after-tax) included in Other Income and Expense, Net in the
consolidated statements of income. The preferred stock was
received in 2000 in connection with the sale of access lines in Iowa.
Certain other investments in securities that we hold are not
adjusted to market values because those values are not readily
determinable and/or the securities are not marketable. We have,
however, adjusted the carrying values of these securities in situa-
tions where we believe declines in value below cost were other than
temporary. The carrying values for investments not adjusted to
market value were $12 million at December 31, 2006 and $5 million
at December 31, 2005.
NOTE 6
PLANT, PROPERTY AND EQUIPMENT
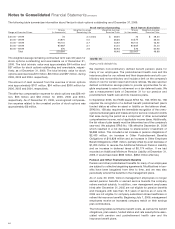
The following table displays the details of plant, property and
equipment, which is stated at cost:
(dollars in millions)
At December 31, 2006 2005
Land $959 $706
Buildings and equipment 19,207 16,312
Network equipment 163,580 152,409
Furniture, office and data
processing equipment 12,789 12,272
Work in progress 2,315 1,475
Leasehold improvements 3,061 2,297
Other 2,198 2,290
204,109 187,761
Accumulated depreciation (121,753) (114,774)
Total $82,356 $72,987