Verizon Wireless 2006 Annual Report Download - page 62
Download and view the complete annual report
Please find page 62 of the 2006 Verizon Wireless annual report below. You can navigate through the pages in the report by either clicking on the pages listed below, or by using the keyword search tool below to find specific information within the annual report.-
 1
1 -
2
-
3
-
4
-
5
-
6
-
7
-
8
-
9
-
10
-
11
-
12
-
13
-
14
-
15
-
16
-
17
-
18
-
19
-
20
-
21
-
22
-
23
-
24
-
25
-
26
-
27
-
28
-
29
-
30
-
31
-
32
-
33
-
34
-
35
-
36
-
37
-
38
-
39
-
40
-
41
-
42
-
43
-
44
-
45
-
46
-
47
-
48
-
49
-
50
-
51
-
 52
52 -
 53
53 -
 54
54 -
 55
55 -
 56
56 -
 57
57 -
 58
58 -
 59
59 -
 60
60 -
 61
61 -
 62
62 -
 63
63 -
 64
64 -
 65
65 -
 66
66 -
 67
67 -
 68
68 -
 69
69 -
 70
70 -
 71
71 -
 72
72 -
73
-
74
-
75
-
76
-
77
-
78
-
79
-
80
-
81
-
82
-
83
-
84
 |
 |

60
unrealized gains of $17 million in Other Comprehensive Income
(Loss) for the year ended December 31, 2004.
Net Investment Hedges
During 2005, we entered into zero cost euro collars to hedge a por-
tion of our net investment in Vodafone Omnitel. In accordance with
the provisions of SFAS No. 133 and related amendments and inter-
pretations, changes in fair value of these contracts due to exchange
rate fluctuations were recognized in Accumulated Other
Comprehensive Loss and offset the impact of foreign currency
changes on the value of our net investment. During 2005, our posi-
tions in the zero cost euro collars were settled. As of December 31,
2006 and 2005, Accumulated Other Comprehensive Loss includes
unrecognized gains of $2 million related to these hedge contracts,
which along with the unrealized foreign currency translation balance
of the investment hedged, remains unless the investment is sold.
During 2004, we entered into foreign currency forward contracts to
hedge our net investment in our Canadian operations. In accor-
dance with the provisions of SFAS No. 133, changes in the fair
value of these contracts due to exchange rate fluctuations were
recognized in Accumulated Other Comprehensive Loss and offset
the impact of foreign currency changes on the value of our net
investment. During 2004, we sold our Canadian operations and the
unrealized losses on these net investment hedge contracts were
recognized in net income along with the corresponding foreign cur-
rency translation balance. We recorded realized losses of $106
million ($58 million after-tax) related to these hedge contracts.
Other Derivatives
On May 17, 2005, we purchased 43.4 million shares of MCI
common stock under a stock purchase agreement that contained a
provision for the payment of an additional cash amount determined
immediately prior to April 9, 2006 based on the market price of
Verizon’s common stock. (See Note 2). Under SFAS No. 133, this
additional cash payment was an embedded derivative which we
carried at fair value and was subject to changes in the market price
of Verizon stock. Since this derivative did not qualify for hedge
accounting under SFAS No. 133, changes in its fair value were
recorded in the consolidated statements of income in Other Income
and (Expense), Net. During 2006 and 2005, we recorded pretax
income of $4 million and $57 million, respectively, in connection
with this embedded derivative. As of December 31, 2006, this
embedded derivative has expired with no requirement for an addi-
tional cash payment made under the stock purchase agreement.
Concentrations of Credit Risk
Financial instruments that subject us to concentrations of credit risk
consist primarily of temporary cash investments, short-term and
long-term investments, trade receivables, certain notes receivable
including lease receivables and derivative contracts. Our policy is to
deposit our temporary cash investments with major financial institu-
tions. Counterparties to our derivative contracts are also major
financial institutions and organized exchanges. The financial institu-
tions have all been accorded high ratings by primary rating
agencies. We limit the dollar amount of contracts entered into with
any one financial institution and monitor our counterparties’ credit
ratings. We generally do not give or receive collateral on swap
agreements due to our credit rating and those of our counterparties.
While we may be exposed to credit losses due to the nonperfor-
mance of our counterparties, we consider the risk remote and do
not expect the settlement of these transactions to have a material
effect on our results of operations or financial condition.
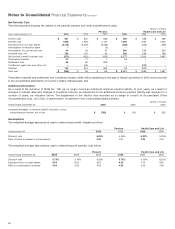
Fair Values of Financial Instruments
The tables that follow provide additional information about our
significant financial instruments:
Financial Instrument Valuation Method
Cash and cash equivalents and Carrying amounts
short-term investments
Short- and long-term debt Market quotes for similar terms
(excluding capital leases) and maturities or future cash flows
discounted at current rates
Cost investments in unconsolidated Future cash flows discounted
businesses, derivative assets at current rates, market quotes for
and liabilities and notes receivable similar instruments or other
valuation models
(dollars in millions)
At December 31, 2006 2005
Carrying Carrying
Amount Fair Value Amount Fair Value
Short- and long-term debt $36,000 $ 37,165 $38,145 $ 39,549
Cost investments in
unconsolidated businesses 270 270 1,089 1,089
Short- and long-term
derivative assets 31 31 62 62
Short- and long-term
derivative liabilities 10 10 21 21
Notes to Consolidated Financial Statements continued