Yahoo 2007 Annual Report Download - page 105
Download and view the complete annual report
Please find page 105 of the 2007 Yahoo annual report below. You can navigate through the pages in the report by either clicking on the pages listed below, or by using the keyword search tool below to find specific information within the annual report.-
 1
1 -
2
-
3
-
4
-
5
-
6
-
7
-
8
-
9
-
10
-
11
-
12
-
13
-
14
-
15
-
16
-
17
-
18
-
19
-
20
-
21
-
22
-
23
-
24
-
25
-
26
-
27
-
28
-
29
-
30
-
31
-
32
-
33
-
34
-
35
-
36
-
37
-
38
-
39
-
40
-
41
-
42
-
43
-
44
-
45
-
46
-
47
-
48
-
49
-
50
-
51
-
52
-
53
-
54
-
55
-
56
-
57
-
58
-
59
-
60
-
61
-
62
-
63
-
64
-
65
-
66
-
67
-
68
-
69
-
70
-
71
-
72
-
73
-
74
-
75
-
76
-
77
-
78
-
79
-
80
-
81
-
82
-
83
-
84
-
85
-
86
-
87
-
88
-
89
-
90
-
91
-
92
-
93
-
94
-
 95
95 -
 96
96 -
 97
97 -
 98
98 -
 99
99 -
 100
100 -
 101
101 -
 102
102 -
 103
103 -
 104
104 -
 105
105 -
 106
106 -
 107
107 -
 108
108 -
 109
109 -
 110
110 -
 111
111 -
 112
112 -
 113
113 -
 114
114 -
 115
115 -
116
-
117
-
118
-
119
-
120
-
121
-
122
-
123
-
124
-
125
-
126
-
127
-
128
-
129
-
130
-
131
-
132
-
133
-
134
-
135
-
136
-
137
-
138
-
139
-
140
-
141
-
142
-
143
-
144
-
145
-
146
-
147
-
148
-
149
-
150
-
151
-
152
-
153
-
154
-
155
-
156
 |
 |

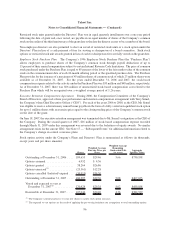
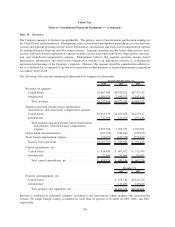
Note 15 SEGMENTS
The Company manages its business geographically. The primary areas of measurement and decision-making are
the United States and International. Management relies on an internal management reporting process that provides
revenue and segment operating income before depreciation, amortization and stock-based compensation expense
for making financial decisions and allocating resources. Segment operating income before depreciation, amor-
tization, and stock-based compensation expense includes income from operations before depreciation, amortiza-
tion, and stock-based compensation expense. Management believes that segment operating income before
depreciation, amortization and stock-based compensation expense is an appropriate measure of evaluating the
operational performance of the Company’s segments. However, this measure should be considered in addition to,
not as a substitute for, or superior to, income from operations or other measures of financial performance prepared in
accordance with GAAP.
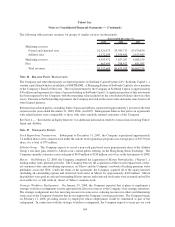
The following tables present summarized information by segment (in thousands):
2005 2006 2007
Years Ended December 31,
Revenues by segment:
United States ................................ $3,667,509 $4,365,922 $4,727,123
International ................................. 1,590,159 2,059,757 2,242,151
Total revenues ............................. $5,257,668 $6,425,679 $6,969,274
Segment operating income before depreciation,
amortization, and stock-based compensation expense:
United States ................................ $1,219,539 $1,451,656 $1,433,617
International ................................. 337,799 454,261 493,418
Total segment operating income before depreciation,
amortization, and stock-based compensation
expense: ................................ 1,557,338 1,905,917 1,927,035
Depreciation and amortization ..................... (397,142) (540,021) (659,195)
Stock-based compensation expense .................. (52,471) (424,930) (572,427)
Income from operations ........................ $1,107,725 $ 940,966 $ 695,413
Capital expenditures, net:
United States ................................ $ 336,450 $ 601,472 $ 515,709
International ................................. 72,484 87,664 86,567
Total capital expenditures, net .................. $ 408,934 $ 689,136 $ 602,276
2006 2007
December 31,
Property and equipment, net:
United States ........................................... $ 975,510 $1,182,212
International............................................ 125,869 149,420
Total property and equipment, net .......................... $1,101,379 $1,331,632
Revenue is attributed to individual countries according to the international online property that generated the
revenue. No single foreign country accounted for more than 10 percent of revenues in 2005, 2006, and 2007,
respectively.
103
Yahoo! Inc.
Notes to Consolidated Financial Statements — (Continued)