Yahoo 2007 Annual Report Download - page 88
Download and view the complete annual report
Please find page 88 of the 2007 Yahoo annual report below. You can navigate through the pages in the report by either clicking on the pages listed below, or by using the keyword search tool below to find specific information within the annual report.-
 1
1 -
2
-
3
-
4
-
5
-
6
-
7
-
8
-
9
-
10
-
11
-
12
-
13
-
14
-
15
-
16
-
17
-
18
-
19
-
20
-
21
-
22
-
23
-
24
-
25
-
26
-
27
-
28
-
29
-
30
-
31
-
32
-
33
-
34
-
35
-
36
-
37
-
38
-
39
-
40
-
41
-
42
-
43
-
44
-
45
-
46
-
47
-
48
-
49
-
50
-
51
-
52
-
53
-
54
-
55
-
56
-
57
-
58
-
59
-
60
-
61
-
62
-
63
-
64
-
65
-
66
-
67
-
68
-
69
-
70
-
71
-
72
-
73
-
74
-
75
-
76
-
77
-
 78
78 -
 79
79 -
 80
80 -
 81
81 -
 82
82 -
 83
83 -
 84
84 -
 85
85 -
 86
86 -
 87
87 -
 88
88 -
 89
89 -
 90
90 -
 91
91 -
 92
92 -
 93
93 -
 94
94 -
 95
95 -
 96
96 -
 97
97 -
 98
98 -
99
-
100
-
101
-
102
-
103
-
104
-
105
-
106
-
107
-
108
-
109
-
110
-
111
-
112
-
113
-
114
-
115
-
116
-
117
-
118
-
119
-
120
-
121
-
122
-
123
-
124
-
125
-
126
-
127
-
128
-
129
-
130
-
131
-
132
-
133
-
134
-
135
-
136
-
137
-
138
-
139
-
140
-
141
-
142
-
143
-
144
-
145
-
146
-
147
-
148
-
149
-
150
-
151
-
152
-
153
-
154
-
155
-
156
 |
 |

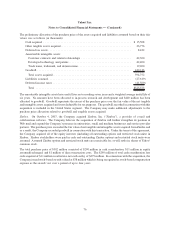
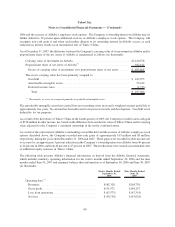
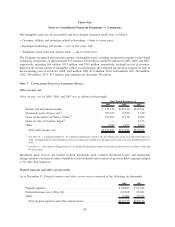
Deferred and other long-term tax liabilities, net
As of December 31, Deferred and other long-term tax liabilities, net consisted of the following (in thousands):
2006 2007
Deferred income taxes ..................................... $ 19,204 $ 15,684
Tax contingency accruals
(*)
................................. — 245,309
Total deferred and other long-term tax liabilities, net (Note 10) ..... $ 19,204 $ 260,993
(*)
Includes interest and penalties.
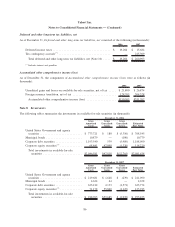
Accumulated other comprehensive income (loss)
As of December 31, the components of Accumulated other comprehensive income (loss) were as follows (in
thousands):
2006 2007
Unrealized gains and losses on available-for-sale securities, net of tax ..... $ 21,800 $ 26,874
Foreign currency translation, net of tax ............................ 128,705 304,328
Accumulated other comprehensive income (loss) ................... $150,505 $331,202
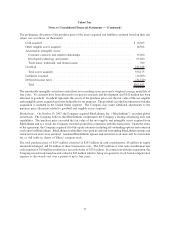
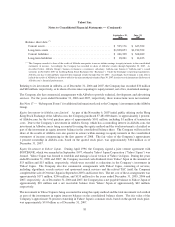
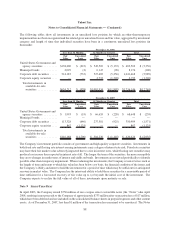
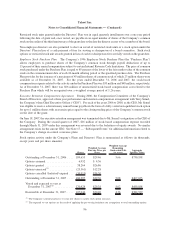
Note 8 INVESTMENTS
The following tables summarize the investments in available-for-sale securities (in thousands):
Gross
Amortized
Costs
Gross
Unrealized
Gains
Gross
Unrealized
Losses
Estimated
Fair Value
December 31, 2006
United States Government and agency
securities ........................... $ 773,721 $ 180 $ (5,356) $ 768,545
Municipal bonds ....................... 10,879 — (100) 10,779
Corporate debt securities ................. 1,193,540 539 (5,989) 1,188,090
Corporate equity securities
(*)
.............. 68,441 47,099 (1,320) 114,220
Total investments in available-for-sale
securities ......................... $2,046,581 $47,818 $(12,765) $2,081,634
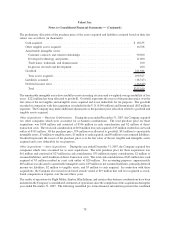
Gross
Amortized
Costs
Gross
Unrealized
Gains
Gross
Unrealized
Losses
Estimated
Fair Value
December 31, 2007
United States Government and agency
securities ........................... $ 219,681 $ 1,648 $ (239) $ 221,090
Municipal bonds ....................... 4,634 44 — 4,678
Corporate debt securities ................. 623,212 2,133 (1,571) 623,774
Corporate equity securities
(*)
.............. 71,178 55,860 (1,125) 125,913
Total investments in available-for-sale
securities ......................... $ 918,705 $59,685 $ (2,935) $ 975,455
86
Yahoo! Inc.
Notes to Consolidated Financial Statements — (Continued)