Yahoo 2007 Annual Report Download - page 62
Download and view the complete annual report
Please find page 62 of the 2007 Yahoo annual report below. You can navigate through the pages in the report by either clicking on the pages listed below, or by using the keyword search tool below to find specific information within the annual report.-
 1
1 -
2
-
3
-
4
-
5
-
6
-
7
-
8
-
9
-
10
-
11
-
12
-
13
-
14
-
15
-
16
-
17
-
18
-
19
-
20
-
21
-
22
-
23
-
24
-
25
-
26
-
27
-
28
-
29
-
30
-
31
-
32
-
33
-
34
-
35
-
36
-
37
-
38
-
39
-
40
-
41
-
42
-
43
-
44
-
45
-
46
-
47
-
48
-
49
-
50
-
51
-
 52
52 -
 53
53 -
 54
54 -
 55
55 -
 56
56 -
 57
57 -
 58
58 -
 59
59 -
 60
60 -
 61
61 -
 62
62 -
 63
63 -
 64
64 -
 65
65 -
 66
66 -
 67
67 -
 68
68 -
 69
69 -
 70
70 -
 71
71 -
 72
72 -
73
-
74
-
75
-
76
-
77
-
78
-
79
-
80
-
81
-
82
-
83
-
84
-
85
-
86
-
87
-
88
-
89
-
90
-
91
-
92
-
93
-
94
-
95
-
96
-
97
-
98
-
99
-
100
-
101
-
102
-
103
-
104
-
105
-
106
-
107
-
108
-
109
-
110
-
111
-
112
-
113
-
114
-
115
-
116
-
117
-
118
-
119
-
120
-
121
-
122
-
123
-
124
-
125
-
126
-
127
-
128
-
129
-
130
-
131
-
132
-
133
-
134
-
135
-
136
-
137
-
138
-
139
-
140
-
141
-
142
-
143
-
144
-
145
-
146
-
147
-
148
-
149
-
150
-
151
-
152
-
153
-
154
-
155
-
156
 |
 |

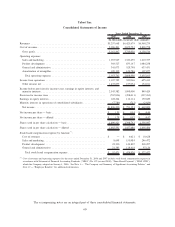
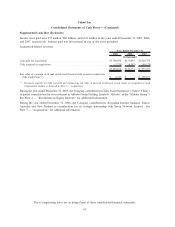
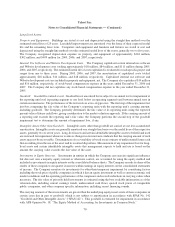
Yahoo! Inc.
Consolidated Statements of Income
2005 2006 2007
Years Ended December 31,
(In thousands, except per share amounts)
Revenues . . . . . . . . . . . . . . . . . . . . . . . . . . . . . . . . . . . . . . . . . . . . . . . . . . $5,257,668 $6,425,679 $6,969,274
Cost of revenues . . . . . . . . . . . . . . . . . . . . . . . . . . . . . . . . . . . . . . . . . . . . . 2,096,201 2,675,723 2,838,758
Gross profit . . . . . . . . . . . . . . . . . . . . . . . . . . . . . . . . . . . . . . . . . . . . . . . 3,161,467 3,749,956 4,130,516
Operating expenses:
Sales and marketing . . . . . . . . . . . . . . . . . . . . . . . . . . . . . . . . . . . . . . . . . 1,033,947 1,322,259 1,610,357
Product development . . . . . . . . . . . . . . . . . . . . . . . . . . . . . . . . . . . . . . . . 569,527 833,147 1,084,238
General and administrative . . . . . . . . . . . . . . . . . . . . . . . . . . . . . . . . . . . . 341,073 528,798 633,431
Amortization of intangibles . . . . . . . . . . . . . . . . . . . . . . . . . . . . . . . . . . . . 109,195 124,786 107,077
Total operating expenses . . . . . . . . . . . . . . . . . . . . . . . . . . . . . . . . . . . . 2,053,742 2,808,990 3,435,103
Income from operations . . . . . . . . . . . . . . . . . . . . . . . . . . . . . . . . . . . . . . . . 1,107,725 940,966 695,413
Other income, net . . . . . . . . . . . . . . . . . . . . . . . . . . . . . . . . . . . . . . . . . . 1,435,857 157,034 154,011
Income before provision for income taxes, earnings in equity interests, and
minority interests . . . . . . . . . . . . . . . . . . . . . . . . . . . . . . . . . . . . . . . . . . . 2,543,582 1,098,000 849,424
Provision for income taxes . . . . . . . . . . . . . . . . . . . . . . . . . . . . . . . . . . . . . . (767,816) (458,011) (337,263)
Earnings in equity interests . . . . . . . . . . . . . . . . . . . . . . . . . . . . . . . . . . . . . . 128,244 112,114 150,689
Minority interests in operations of consolidated subsidiaries . . . . . . . . . . . . . . . (7,780) (712) (2,850)
Net income . . . . . . . . . . . . . . . . . . . . . . . . . . . . . . . . . . . . . . . . . . . . . . . $1,896,230 $ 751,391 $ 660,000
Net income per share — basic . . . . . . . . . . . . . . . . . . . . . . . . . . . . . . . . . . . . $ 1.35 $ 0.54 $ 0.49
Net income per share — diluted . . . . . . . . . . . . . . . . . . . . . . . . . . . . . . . . . . $ 1.28 $ 0.52 $ 0.47
Shares used in per share calculation — basic. . . . . . . . . . . . . . . . . . . . . . . . . . 1,400,421 1,388,741 1,338,987
Shares used in per share calculation — diluted . . . . . . . . . . . . . . . . . . . . . . . . 1,485,591 1,457,686 1,405,486
Stock-based compensation expense by function
(*)
:
Cost of revenues . . . . . . . . . . . . . . . . . . . . . . . . . . . . . . . . . . . . . . . . . . . $ — $ 6,621 $ 10,628
Sales and marketing . . . . . . . . . . . . . . . . . . . . . . . . . . . . . . . . . . . . . . . . . 8,698 155,084 246,472
Product development . . . . . . . . . . . . . . . . . . . . . . . . . . . . . . . . . . . . . . . . 22,390 144,807 218,207
General and administrative . . . . . . . . . . . . . . . . . . . . . . . . . . . . . . . . . . . . 21,383 118,418 97,120
Total stock-based compensation expense . . . . . . . . . . . . . . . . . . . . . . . . . $ 52,471 $ 424,930 $ 572,427
(*)
Cost of revenues and operating expenses for the years ended December 31, 2006 and 2007 include stock-based compensation expense in
accordance with Statement of Financial Accounting Standards (“SFAS”) No. 123 (revised 2004), “Share-Based Payment” (“SFAS 123R”),
which the Company adopted on January 1, 2006. See Note 1 — “The Company and Summary of Significant Accounting Policies” and
Note 12 — “Employee Benefits” for additional information.
The accompanying notes are an integral part of these consolidated financial statements.
60