Yahoo 2007 Annual Report Download - page 44
Download and view the complete annual report
Please find page 44 of the 2007 Yahoo annual report below. You can navigate through the pages in the report by either clicking on the pages listed below, or by using the keyword search tool below to find specific information within the annual report.-
 1
1 -
2
-
3
-
4
-
5
-
6
-
7
-
8
-
9
-
10
-
11
-
12
-
13
-
14
-
15
-
16
-
17
-
18
-
19
-
20
-
21
-
22
-
23
-
24
-
25
-
26
-
27
-
28
-
29
-
30
-
31
-
32
-
33
-
 34
34 -
 35
35 -
 36
36 -
 37
37 -
 38
38 -
 39
39 -
 40
40 -
 41
41 -
 42
42 -
 43
43 -
 44
44 -
 45
45 -
 46
46 -
 47
47 -
 48
48 -
 49
49 -
 50
50 -
 51
51 -
 52
52 -
 53
53 -
 54
54 -
55
-
56
-
57
-
58
-
59
-
60
-
61
-
62
-
63
-
64
-
65
-
66
-
67
-
68
-
69
-
70
-
71
-
72
-
73
-
74
-
75
-
76
-
77
-
78
-
79
-
80
-
81
-
82
-
83
-
84
-
85
-
86
-
87
-
88
-
89
-
90
-
91
-
92
-
93
-
94
-
95
-
96
-
97
-
98
-
99
-
100
-
101
-
102
-
103
-
104
-
105
-
106
-
107
-
108
-
109
-
110
-
111
-
112
-
113
-
114
-
115
-
116
-
117
-
118
-
119
-
120
-
121
-
122
-
123
-
124
-
125
-
126
-
127
-
128
-
129
-
130
-
131
-
132
-
133
-
134
-
135
-
136
-
137
-
138
-
139
-
140
-
141
-
142
-
143
-
144
-
145
-
146
-
147
-
148
-
149
-
150
-
151
-
152
-
153
-
154
-
155
-
156
 |
 |

December 31, 2007, compared to approximately $3.50 and $4.00 for the same periods in 2006 and 2005,
respectively. The decline in average monthly revenues per paying user reflects decreases in fees made in the year.
Recently, we have been working with our broadband Internet access partners (“partners”) to renew and extend our
relationships. As we renew these access relationships, we are seeking to add new opportunities to improve on our
historic strengths in portal, search, and mail. The market has moved to an environment in which advertising revenue
sharing is the prevailing model, and we are evolving our partnerships accordingly and our partners are re-signing
with us due to the strategic importance of our relationships and the products we offer. This will result in a reduction
in fees revenues associated with these deals, but should be offset by increased marketing services revenues
associated with the display advertising and sponsored search revenue share arrangements.
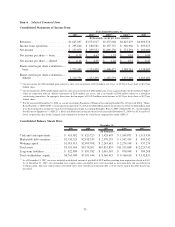
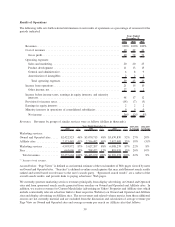
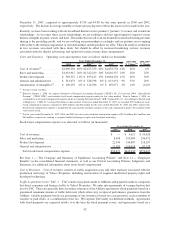
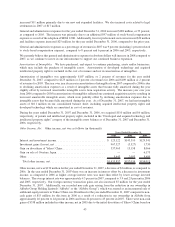
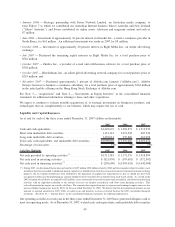
Costs and Expenses. Operating costs and expenses were as follows (dollars in thousands):
2005
(1)
2006
(2) (1)
2007
(1)
2005-2006
% Change
(2)
2006-2007
% Change
Years Ended December 31,
Cost of revenues
(3)
........... $2,096,201 40% $2,675,723 42% $2,838,758 41% 28% 6%
Sales and marketing .......... $1,033,947 20% $1,322,259 20% $1,610,357 23% 28% 22%
Product development ......... $ 569,527 11% $ 833,147 13% $1,084,238 15% 46% 30%
General and administrative ..... $ 341,073 6% $ 528,798 8% $ 633,431 9% 55% 20%
Amortization of intangibles
(3)
. . . $ 109,195 2% $ 124,786 2% $ 107,077 2% 14% (14)%
(1)
Percent of total revenues.
(2)
Effective January 1, 2006, we adopted Statement of Financial Accounting Standards (“SFAS”) No. 123 (revised 2004), “Share-Based
Payment” (“SFAS 123R”) and recorded stock-based compensation expense under the fair value method. Prior to January 1, 2006, we
accounted for stock-based compensation expense under Accounting Principles Board (“APB”) Opinion No. 25, “Accounting for Stock Issued
to Employees” (“APB 25”) and used the intrinsic value method. In the year ended December 31, 2007, we recorded $572 million of stock-
based compensation expense compared to $425 million and $52 million for the years ended December 31, 2006 and 2005, respectively.
Stock-based compensation expense is included in the same income statement category as the cash compensation paid to the recipient of the
stock-based award.
(3)
For the years ended December 31, 2007, 2006, and 2005 cost of revenues included amortization expense of $143 million, $113 million, and
$64 million, respectively, relating to acquired intellectual property rights and developed technology.
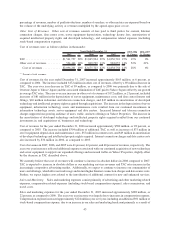
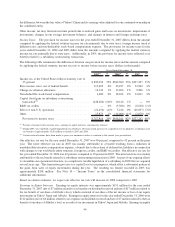
Stock-based compensation expense was allocated as follows (in thousands):
2005 2006 2007
Years Ended December 31,
Cost of revenues ............................................ $ — $ 6,621 $ 10,628
Sales and marketing ......................................... 8,698 155,084 246,472
Product development ........................................ 22,390 144,807 218,207
General and administrative .................................... 21,383 118,418 97,120
Total stock-based compensation expense ........................ $52,471 $424,930 $572,427
See Note 1 — “The Company and Summary of Significant Accounting Policies” and Note 12 — “Employee
Benefits” in the consolidated financial statements, as well as our Critical Accounting Policies, Judgments, and
Estimates, for additional information about stock-based compensation.
Cost of Revenues. Cost of revenues consists of traffic acquisition costs and other expenses associated with the
production and usage of Yahoo! Properties, including amortization of acquired intellectual property rights and
developed technology.
Traffic Acquisition Costs (“TAC”). TAC consist of payments made to Affiliates and payments made to companies
that direct consumer and business traffic to Yahoo! Properties. We enter into agreements of varying duration that
involve TAC. There are generally three economic structures of the Affiliate agreements: fixed payments based on a
guaranteed minimum amount of traffic delivered, which often carry reciprocal performance guarantees from the
Affiliate; variable payments based on a percentage of our revenues or based on a certain metric, such as number of
searches or paid clicks; or a combination of the two. We expense TAC under two different methods. Agreements
with fixed payments are expensed ratably over the term the fixed payment covers, and agreements based on a
42