Yahoo 2007 Annual Report Download - page 51
Download and view the complete annual report
Please find page 51 of the 2007 Yahoo annual report below. You can navigate through the pages in the report by either clicking on the pages listed below, or by using the keyword search tool below to find specific information within the annual report.-
 1
1 -
2
-
3
-
4
-
5
-
6
-
7
-
8
-
9
-
10
-
11
-
12
-
13
-
14
-
15
-
16
-
17
-
18
-
19
-
20
-
21
-
22
-
23
-
24
-
25
-
26
-
27
-
28
-
29
-
30
-
31
-
32
-
33
-
34
-
35
-
36
-
37
-
38
-
39
-
40
-
 41
41 -
 42
42 -
 43
43 -
 44
44 -
 45
45 -
 46
46 -
 47
47 -
 48
48 -
 49
49 -
 50
50 -
 51
51 -
 52
52 -
 53
53 -
 54
54 -
 55
55 -
 56
56 -
 57
57 -
 58
58 -
 59
59 -
 60
60 -
 61
61 -
62
-
63
-
64
-
65
-
66
-
67
-
68
-
69
-
70
-
71
-
72
-
73
-
74
-
75
-
76
-
77
-
78
-
79
-
80
-
81
-
82
-
83
-
84
-
85
-
86
-
87
-
88
-
89
-
90
-
91
-
92
-
93
-
94
-
95
-
96
-
97
-
98
-
99
-
100
-
101
-
102
-
103
-
104
-
105
-
106
-
107
-
108
-
109
-
110
-
111
-
112
-
113
-
114
-
115
-
116
-
117
-
118
-
119
-
120
-
121
-
122
-
123
-
124
-
125
-
126
-
127
-
128
-
129
-
130
-
131
-
132
-
133
-
134
-
135
-
136
-
137
-
138
-
139
-
140
-
141
-
142
-
143
-
144
-
145
-
146
-
147
-
148
-
149
-
150
-
151
-
152
-
153
-
154
-
155
-
156
 |
 |

•January 2006 — Strategic partnership with Seven Network Limited, an Australian media company, to
form Yahoo! 7 to which we contributed our Australian Internet business Yahoo! Australia and New Zealand
(“Yahoo! Australia”), and Seven contributed its online assets, television and magazine content and cash of
$7 million;
•June 2006 — Investment of approximately 10 percent interest in Gmarket Inc., a retail e-commerce provider in
South Korea, for $61 million. An additional investment was made in 2007 for $8 million;
•October 2006 — Investment of approximately 20 percent interest in Right Media Inc., an online advertising
exchange;
•July 2007 — Purchased the remaining equity interests in Right Media Inc. for a total purchase price of
$526 million;
•October 2007 — Zimbra, Inc., a provider of e-mail and collaboration software for a total purchase price of
$302 million;
•October 2007 — BlueLithium, Inc., an online global advertising network company for a total purchase price of
$255 million; and
•November 2007 — Purchased approximately 1 percent of Alibaba.com Limited (“Alibaba.com”), Alibaba
Group’s business-to-business e-commerce subsidiary, for a total purchase price of approximately $101 million
in the initial public offering on the Hong Kong Stock Exchange of Alibaba.com.
See Note 3 — “Acquisitions” and Note 4 — “Investments in Equity Interests” in the consolidated financial
statements for additional information relating to these and other acquisitions.
We expect to continue to evaluate possible acquisitions of, or strategic investments in, businesses, products, and
technologies that are complementary to our business, which may require the use of cash.
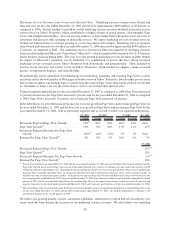
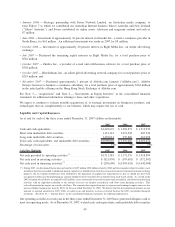
Liquidity and Capital Resources
As of and for each of the three years ended December 31, 2007 (dollars in thousands):
2005 2006 2007
Cash and cash equivalents .............................. $1,429,693 $ 1,569,871 $ 1,513,930
Short-term marketable debt securities ...................... 1,131,141 1,031,528 487,544
Long-term marketable debt securities ...................... 1,439,014 935,886 361,998
Total cash, cash equivalents, and marketable debt securities ...... $3,999,848 $ 3,537,285 $ 2,363,472
Percentage of total assets ............................... 37% 31% 19%
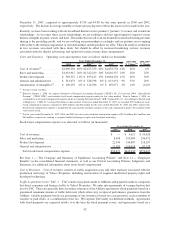
Cash Flow Highlights 2005 2006 2007
Net cash provided by operating activities
(*)
.................. $1,711,383 $ 1,371,576 $ 1,918,899
Net cash used in investing activities ....................... $ (821,930) $ (193,681) $ (572,502)
Net cash used in financing activities
(*)
..................... $ (250,600) $(1,094,624) $(1,442,008)
(*) During 2007, we determined that income tax benefits of $127 million ($92 million related to 2006 and the remainder related to earlier years)
should not have been recorded to additional paid-in capital as tax benefits from stock-based awards because for financial statement ordering
purposes, the tax benefits should have been attributed to the utilization of acquired net operating losses first or should not have been
recognized at all because the underlying tax amounts should not have been offset by tax benefits from stock-based awards. As a result, in the
2007 statement of cash flows, we reduced by $92 million, excess tax benefits from stock-based awards recorded in cash flows from operating
activities with an equivalent reduction to the amount of excess tax benefits recorded in cash flows from financing activities. This
reclassification had no impact on overall cash flows. The amounts that impacted income tax expense and earnings in equity interests also
increased diluted earnings per share by $0.01 for the year ended December 31, 2007. We believe that the aforementioned amounts are not
material to reported amounts for 2007, 2006, or earlier years and therefore we have corrected them in the 2007 consolidated financial
statements. See Note 10 — “Income Taxes” in the consolidated financial statements for additional information.
Our operating activities for each year in the three years ended December 31, 2007 have generated adequate cash to
meet our operating needs. As of December 31, 2007, we had cash, cash equivalents, and marketable debt securities
49