Yahoo 2007 Annual Report Download - page 66
Download and view the complete annual report
Please find page 66 of the 2007 Yahoo annual report below. You can navigate through the pages in the report by either clicking on the pages listed below, or by using the keyword search tool below to find specific information within the annual report.-
 1
1 -
2
-
3
-
4
-
5
-
6
-
7
-
8
-
9
-
10
-
11
-
12
-
13
-
14
-
15
-
16
-
17
-
18
-
19
-
20
-
21
-
22
-
23
-
24
-
25
-
26
-
27
-
28
-
29
-
30
-
31
-
32
-
33
-
34
-
35
-
36
-
37
-
38
-
39
-
40
-
41
-
42
-
43
-
44
-
45
-
46
-
47
-
48
-
49
-
50
-
51
-
52
-
53
-
54
-
55
-
 56
56 -
 57
57 -
 58
58 -
 59
59 -
 60
60 -
 61
61 -
 62
62 -
 63
63 -
 64
64 -
 65
65 -
 66
66 -
 67
67 -
 68
68 -
 69
69 -
 70
70 -
 71
71 -
 72
72 -
 73
73 -
 74
74 -
 75
75 -
 76
76 -
77
-
78
-
79
-
80
-
81
-
82
-
83
-
84
-
85
-
86
-
87
-
88
-
89
-
90
-
91
-
92
-
93
-
94
-
95
-
96
-
97
-
98
-
99
-
100
-
101
-
102
-
103
-
104
-
105
-
106
-
107
-
108
-
109
-
110
-
111
-
112
-
113
-
114
-
115
-
116
-
117
-
118
-
119
-
120
-
121
-
122
-
123
-
124
-
125
-
126
-
127
-
128
-
129
-
130
-
131
-
132
-
133
-
134
-
135
-
136
-
137
-
138
-
139
-
140
-
141
-
142
-
143
-
144
-
145
-
146
-
147
-
148
-
149
-
150
-
151
-
152
-
153
-
154
-
155
-
156
 |
 |

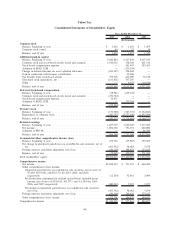
Yahoo! Inc.
Consolidated Statements of Stockholders’ Equity
2005 2006 2007
Years Ended December 31,
(In thousands)
Common stock
Balance, beginning of year . . . . . . . . . . . . . . . . . . . . . . . . . . . . . . . . . . . $ 1,416 $ 1,470 $ 1,493
Common stock issued. . . . . . . . . . . . . . . . . . . . . . . . . . . . . . . . . . . . . . . 54 23 34
Balance, end of year . . . . . . . . . . . . . . . . . . . . . . . . . . . . . . . . . . . . . . . 1,470 1,493 1,527
Additional paid-in capital
Balance, beginning of year . . . . . . . . . . . . . . . . . . . . . . . . . . . . . . . . . . . 5,682,884 6,417,858 8,615,915
Common stock and stock-based awards issued and assumed . . . . . . . . . . . . 1,010,012 318,160 661,516
Stock-based compensation expense . . . . . . . . . . . . . . . . . . . . . . . . . . . . . — 451,467 593,451
Adoption of SFAS 123R . . . . . . . . . . . . . . . . . . . . . . . . . . . . . . . . . . . . . — (235,394) —
Change in deferred income tax asset valuation allowance . . . . . . . . . . . . . . (423,147) 236,044 —
Gain in connection with business contribution . . . . . . . . . . . . . . . . . . . . . . — 29,944 —
Tax benefits from stock-based awards. . . . . . . . . . . . . . . . . . . . . . . . . . . . 759,530 626,009 76,138
Structured stock repurchases, net . . . . . . . . . . . . . . . . . . . . . . . . . . . . . . . (611,421) 767,295 —
Other . . . . . . . . . . . . . . . . . . . . . . . . . . . . . . . . . . . . . . . . . . . . . . . . . . — 4,532 (10,010)
Balance, end of year . . . . . . . . . . . . . . . . . . . . . . . . . . . . . . . . . . . . . . . 6,417,858 8,615,915 9,937,010
Deferred stock-based compensation
Balance, beginning of year . . . . . . . . . . . . . . . . . . . . . . . . . . . . . . . . . . . (28,541) (235,394) —
Common stock and stock-based awards issued and assumed . . . . . . . . . . . . (259,324) — —
Stock-based compensation expense . . . . . . . . . . . . . . . . . . . . . . . . . . . . . 52,471 — —
Adoption of SFAS 123R . . . . . . . . . . . . . . . . . . . . . . . . . . . . . . . . . . . . . — 235,394 —
Balance, end of year . . . . . . . . . . . . . . . . . . . . . . . . . . . . . . . . . . . . . . . (235,394) — —
Treasury stock
Balance, beginning of year . . . . . . . . . . . . . . . . . . . . . . . . . . . . . . . . . . . (159,988) (547,723) (3,324,863)
Repurchases of common stock. . . . . . . . . . . . . . . . . . . . . . . . . . . . . . . . . (387,735) (2,777,140) (1,835,909)
Balance, end of year . . . . . . . . . . . . . . . . . . . . . . . . . . . . . . . . . . . . . . . (547,723) (3,324,863) (5,160,772)
Retained earnings
Balance, beginning of year . . . . . . . . . . . . . . . . . . . . . . . . . . . . . . . . . . . 1,069,939 2,966,169 3,717,560
Net income . . . . . . . . . . . . . . . . . . . . . . . . . . . . . . . . . . . . . . . . . . . . . . 1,896,230 751,391 660,000
Adoption of FIN 48 . . . . . . . . . . . . . . . . . . . . . . . . . . . . . . . . . . . . . . . . — — 46,304
Balance, end of year . . . . . . . . . . . . . . . . . . . . . . . . . . . . . . . . . . . . . . . 2,966,169 3,717,560 4,423,864
Accumulated other comprehensive income (loss)
Balance, beginning of year . . . . . . . . . . . . . . . . . . . . . . . . . . . . . . . . . . . 535,736 (35,965) 150,505
Net change in unrealized gains/losses on available-for-sale securities, net of
tax . . . . . . . . . . . . . . . . . . . . . . . . . . . . . . . . . . . . . . . . . . . . . . . . . . (491,532) 38,018 5,074
Foreign currency translation adjustment, net of tax . . . . . . . . . . . . . . . . . . (80,169) 148,452 175,623
Balance, end of year . . . . . . . . . . . . . . . . . . . . . . . . . . . . . . . . . . . . . . . (35,965) 150,505 331,202
Total stockholders’ equity. . . . . . . . . . . . . . . . . . . . . . . . . . . . . . . . . . . . . . $8,566,415 $ 9,160,610 $ 9,532,831
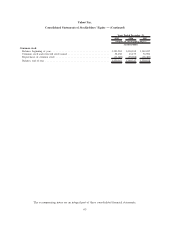
Comprehensive income
Net income . . . . . . . . . . . . . . . . . . . . . . . . . . . . . . . . . . . . . . . . . . . . . . $1,896,230 $ 751,391 $ 660,000
Other comprehensive (loss) income:
Unrealized gains/(losses) on available-for-sale securities, net of taxes of
$7,669, $(29,914), and $(8,131) for 2005, 2006, and 2007,
respectively . . . . . . . . . . . . . . . . . . . . . . . . . . . . . . . . . . . . . . . . . . (11,510) 32,961 2,999
Reclassification adjustment for realized (gains)/losses included in net
income, net of taxes of $320,015, $(3,371), and $(1,384) for 2005,
2006, and 2007, respectively . . . . . . . . . . . . . . . . . . . . . . . . . . . . . . (480,022) 5,057 2,075
Net change in unrealized gains/(losses) on available-for-sale securities,
net of tax . . . . . . . . . . . . . . . . . . . . . . . . . . . . . . . . . . . . . . . . . . . . (491,532) 38,018 5,074
Foreign currency translation adjustment, net of tax . . . . . . . . . . . . . . . . . . (80,169) 148,452 175,623
Other comprehensive (loss) income . . . . . . . . . . . . . . . . . . . . . . . . . . . . . (571,701) 186,470 180,697
Comprehensive income . . . . . . . . . . . . . . . . . . . . . . . . . . . . . . . . . . . . . . . $1,324,529 $ 937,861 $ 840,697
64