Yahoo 2007 Annual Report Download - page 74
Download and view the complete annual report
Please find page 74 of the 2007 Yahoo annual report below. You can navigate through the pages in the report by either clicking on the pages listed below, or by using the keyword search tool below to find specific information within the annual report.-
 1
1 -
2
-
3
-
4
-
5
-
6
-
7
-
8
-
9
-
10
-
11
-
12
-
13
-
14
-
15
-
16
-
17
-
18
-
19
-
20
-
21
-
22
-
23
-
24
-
25
-
26
-
27
-
28
-
29
-
30
-
31
-
32
-
33
-
34
-
35
-
36
-
37
-
38
-
39
-
40
-
41
-
42
-
43
-
44
-
45
-
46
-
47
-
48
-
49
-
50
-
51
-
52
-
53
-
54
-
55
-
56
-
57
-
58
-
59
-
60
-
61
-
62
-
63
-
 64
64 -
 65
65 -
 66
66 -
 67
67 -
 68
68 -
 69
69 -
 70
70 -
 71
71 -
 72
72 -
 73
73 -
 74
74 -
 75
75 -
 76
76 -
 77
77 -
 78
78 -
 79
79 -
 80
80 -
 81
81 -
 82
82 -
 83
83 -
 84
84 -
85
-
86
-
87
-
88
-
89
-
90
-
91
-
92
-
93
-
94
-
95
-
96
-
97
-
98
-
99
-
100
-
101
-
102
-
103
-
104
-
105
-
106
-
107
-
108
-
109
-
110
-
111
-
112
-
113
-
114
-
115
-
116
-
117
-
118
-
119
-
120
-
121
-
122
-
123
-
124
-
125
-
126
-
127
-
128
-
129
-
130
-
131
-
132
-
133
-
134
-
135
-
136
-
137
-
138
-
139
-
140
-
141
-
142
-
143
-
144
-
145
-
146
-
147
-
148
-
149
-
150
-
151
-
152
-
153
-
154
-
155
-
156
 |
 |

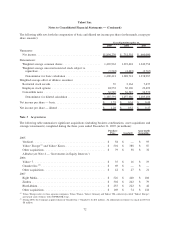
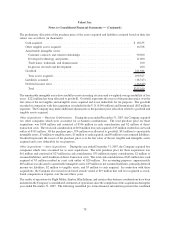
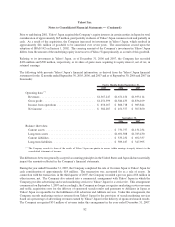
The following table sets forth the computation of basic and diluted net income per share (in thousands, except per
share amounts):
2005 2006 2007
Years Ended December 31,
Numerator:
Net income ......................................... $1,896,230 $ 751,391 $ 660,000
Denominator:
Weighted average common shares ........................ 1,403,963 1,393,424 1,342,754
Weighted average unvested restricted stock subject to
repurchase........................................ (3,542) (4,683) (3,767)
Denominator for basic calculation ...................... 1,400,421 1,388,741 1,338,987
Weighted average effect of dilutive securities:
Restricted stock awards ................................ 33 2,164 7,437
Employee stock options ............................... 48,552 30,196 22,492
Convertible notes .................................... 36,585 36,585 36,570
Denominator for diluted calculation ..................... 1,485,591 1,457,686 1,405,486
Net income per share — basic ............................. $ 1.35 $ 0.54 $ 0.49
Net income per share — diluted ........................... $ 1.28 $ 0.52 $ 0.47
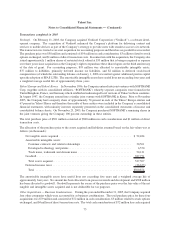
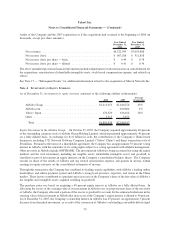
Note 3 ACQUISITIONS
The following table summarizes significant acquisitions (including business combinations, asset acquisitions and
strategic investments) completed during the three years ended December 31, 2007 (in millions):
Purchase
Price Goodwill
Amortizable
Intangibles
2005
Verdisoft .............................................. $ 58 $ — $ 93
Yahoo! Europe
(1)
and Yahoo! Korea.......................... $ 501 $ 388 $ 87
Other acquisitions ....................................... $ 79 $ 58 $ 32
Alibaba (see Note 4 — “Investments in Equity Interests”)
2006
Yahoo! 7.............................................. $ 35 $ 16 $ 19
Gmarket Inc.
(2)
......................................... $ 69 $ — $ —
Other acquisitions ....................................... $ 42 $ 27 $ 21
2007
Right Media ........................................... $ 526 $ 440 $ 104
Zimbra ............................................... $ 302 $ 242 $ 79
BlueLithium ........................................... $ 255 $ 222 $ 42
Other acquisitions ....................................... $ 169 $ 74 $ 118
(1)
Yahoo! Europe refers to three separate companies, Yahoo! France, Yahoo! Germany and Yahoo! UK, collectively called “Yahoo! Europe”,
previously joint ventures with SOFTBANK Corp.
(2)
During 2006, the Company acquired shares in Gmarket Inc. (“Gmarket”) for $61 million. An additional investment was made in 2007 for
$8 million.
72
Yahoo! Inc.
Notes to Consolidated Financial Statements — (Continued)