Yahoo 2007 Annual Report Download - page 42
Download and view the complete annual report
Please find page 42 of the 2007 Yahoo annual report below. You can navigate through the pages in the report by either clicking on the pages listed below, or by using the keyword search tool below to find specific information within the annual report.-
 1
1 -
2
-
3
-
4
-
5
-
6
-
7
-
8
-
9
-
10
-
11
-
12
-
13
-
14
-
15
-
16
-
17
-
18
-
19
-
20
-
21
-
22
-
23
-
24
-
25
-
26
-
27
-
28
-
29
-
30
-
31
-
 32
32 -
 33
33 -
 34
34 -
 35
35 -
 36
36 -
 37
37 -
 38
38 -
 39
39 -
 40
40 -
 41
41 -
 42
42 -
 43
43 -
 44
44 -
 45
45 -
 46
46 -
 47
47 -
 48
48 -
 49
49 -
 50
50 -
 51
51 -
 52
52 -
53
-
54
-
55
-
56
-
57
-
58
-
59
-
60
-
61
-
62
-
63
-
64
-
65
-
66
-
67
-
68
-
69
-
70
-
71
-
72
-
73
-
74
-
75
-
76
-
77
-
78
-
79
-
80
-
81
-
82
-
83
-
84
-
85
-
86
-
87
-
88
-
89
-
90
-
91
-
92
-
93
-
94
-
95
-
96
-
97
-
98
-
99
-
100
-
101
-
102
-
103
-
104
-
105
-
106
-
107
-
108
-
109
-
110
-
111
-
112
-
113
-
114
-
115
-
116
-
117
-
118
-
119
-
120
-
121
-
122
-
123
-
124
-
125
-
126
-
127
-
128
-
129
-
130
-
131
-
132
-
133
-
134
-
135
-
136
-
137
-
138
-
139
-
140
-
141
-
142
-
143
-
144
-
145
-
146
-
147
-
148
-
149
-
150
-
151
-
152
-
153
-
154
-
155
-
156
 |
 |

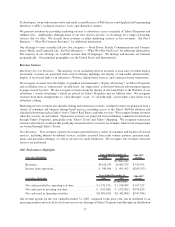
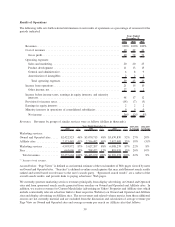
Marketing Services Revenues from Owned and Operated Sites. Marketing services revenues from Owned and
Operated sites for the year ended December 31, 2007 increased by approximately $600 million, or 20 percent, as
compared to 2006. Factors leading to growth in overall marketing services revenues included an increase in user
activity levels on Yahoo! Properties, which contributed to a higher volume of search queries, click-throughs, Page
Views, and ad impression displays. Also our growing audience of users makes Yahoo! Properties more attractive to
advertisers and increases their spending on marketing services. We expect marketing services revenues from our
Owned and Operated sites to continue growing at a rate faster than total revenues. Marketing services revenues
from Owned and Operated sites for the year ended December 31, 2006 increased by approximately $648 million, or
27 percent, as compared to 2005. Our marketing services revenues in 2006 was impacted by declining revenues
from our relationship with Microsoft Corporation (“Microsoft”), which completed the transition of its U.S. business
search business in-house during 2006. The year over year growth in marketing services revenues in 2006, despite
the impact of Microsoft’s transition, can be attributed to a combination of factors that have driven increased
marketing services revenues across Yahoo! Properties both domestically and internationally. These included an
increase in our user base and activity levels on Yahoo! Properties, which resulted in a higher volume of search
queries, ad impression displays, and click-throughs.
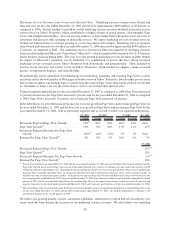
We periodically review and refine our methodology for monitoring, gathering, and counting Page Views to more
accurately reflect the total number of Web pages viewed by users on Yahoo! Properties. Based on this process, from
time to time we update our methodology to exclude from the count of Page Views interactions with our servers that
we determine or believe are not the result of user visits to our Owned and Operated sites.
Using our updated methodology, for the year ended December 31, 2007 as compared to 2006, Page Views increased
11 percent and revenue per Page View increased 7 percent, and for the year ended December 31, 2006 as compared
to 2005, Page Views increased 15 percent and revenue per Page View increased 10 percent.
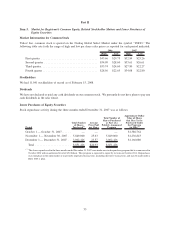
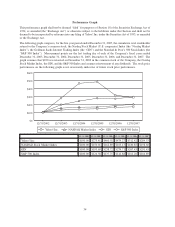
In the table below, we set forth the quarterly and year over year growth in Page Views and revenue per Page View for
the year ended December 31, 2007 and the year over year growth in Page Views and revenue per Page View for the
year ended December 31, 2006, both as previously reported and as revised to reflect our updated methodology.
3 months 3 months 6 months 3 months 9 months 12 months
Q1 2007 Q2 2007 Q3 2007 FY 2007
Previously Reported Page View Growth ........ 19%
(1)
19% 20% 20% 18% N/A
Page View Growth
(2)
...................... 13% 8% 10% 13% 11% 11%
Previously Reported Revenue Per Page View
Growth.............................. (9)%
(1)
(1)% (3)% 3% 1% N/A
Revenue Per Page View Growth
(2)
............ 0% 9% 5% 10% 6% 7%
FY 2006
Previously Reported Page View Growth .............................................. 21%
(1)
Page View Growth
(2)
............................................................ 15%
Previously Reported Revenue Per Page View Growth .................................... 1%
(1)
Revenue Per Page View Growth
(2)
.................................................. 10%
(1)
For the three month period ended March 31, 2007 and the year ended December 31, 2006, the reported Page View Growth and Revenue Per
Page View Growth were based on Page Views on our Owned and Operated sites, searches on Affiliate sites and associated revenues on both
Owned and Operated and Affiliate sites. Beginning in the second quarter of 2007, we revised our presentation of Page Views and Revenue
Per Page View to include only Page Views on Owned and Operated sites and revenues from such Page Views, and to exclude searches on
Affiliate sites and revenues from such searches. If the previously reported Page View Growth and Revenue Per Page View Growth for the
three month period ended March 31, 2007 and year ended December 31, 2006 were adjusted to reflect the presentation adopted in the second
quarter of 2007 (but not our updated methodology for counting Page Views), the reported percentages would have been 21 percent, and
negative 6 percent, for the three month period ended March 31, 2007 and 21 percent, and 5 percent, for the year ended December 31, 2006.
(2)
The revised Page View Growth and Revenue Per Page View Growth numbers reflect our updated methodology for counting Page Views, and
for the year ended December 31, 2006 and the three month period ended March 31, 2007, also include adjustments to conform to the
presentation adopted in the second quarter of 2007.
We believe our growing number of users, advertisers, publishers, and inventory, both on and off our network, over
recent years has been driving the increases in our marketing services revenues. We also believe our expanding
40