Yahoo 2007 Annual Report Download - page 37
Download and view the complete annual report
Please find page 37 of the 2007 Yahoo annual report below. You can navigate through the pages in the report by either clicking on the pages listed below, or by using the keyword search tool below to find specific information within the annual report.-
 1
1 -
2
-
3
-
4
-
5
-
6
-
7
-
8
-
9
-
10
-
11
-
12
-
13
-
14
-
15
-
16
-
17
-
18
-
19
-
20
-
21
-
22
-
23
-
24
-
25
-
26
-
 27
27 -
 28
28 -
 29
29 -
 30
30 -
 31
31 -
 32
32 -
 33
33 -
 34
34 -
 35
35 -
 36
36 -
 37
37 -
 38
38 -
 39
39 -
 40
40 -
 41
41 -
 42
42 -
 43
43 -
 44
44 -
 45
45 -
 46
46 -
 47
47 -
48
-
49
-
50
-
51
-
52
-
53
-
54
-
55
-
56
-
57
-
58
-
59
-
60
-
61
-
62
-
63
-
64
-
65
-
66
-
67
-
68
-
69
-
70
-
71
-
72
-
73
-
74
-
75
-
76
-
77
-
78
-
79
-
80
-
81
-
82
-
83
-
84
-
85
-
86
-
87
-
88
-
89
-
90
-
91
-
92
-
93
-
94
-
95
-
96
-
97
-
98
-
99
-
100
-
101
-
102
-
103
-
104
-
105
-
106
-
107
-
108
-
109
-
110
-
111
-
112
-
113
-
114
-
115
-
116
-
117
-
118
-
119
-
120
-
121
-
122
-
123
-
124
-
125
-
126
-
127
-
128
-
129
-
130
-
131
-
132
-
133
-
134
-
135
-
136
-
137
-
138
-
139
-
140
-
141
-
142
-
143
-
144
-
145
-
146
-
147
-
148
-
149
-
150
-
151
-
152
-
153
-
154
-
155
-
156
 |
 |

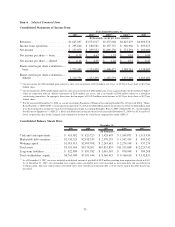
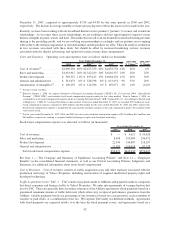
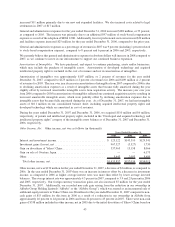
Item 6. Selected Financial Data
Consolidated Statements of Income Data:
2003 2004
(1)
2005
(2)
2006
(3)
2007
Years Ended December 31,
(In thousands, except per share amounts)
Revenues ...................... $1,625,097 $3,574,517 $5,257,668 $6,425,679 $6,969,274
Income from operations ........... $ 295,666 $ 688,581 $1,107,725 $ 940,966 $ 695,413
Net income ..................... $ 237,879 $ 839,553 $1,896,230 $ 751,391 $ 660,000
Net income per share — basic ....... $ 0.19 $ 0.62 $ 1.35 $ 0.54 $ 0.49
Net income per share — diluted ..... $ 0.18 $ 0.58 $ 1.28 $ 0.52 $ 0.47
Shares used in per share calculation —
basic ........................ 1,233,480 1,353,439 1,400,421 1,388,741 1,338,987
Shares used in per share calculation —
diluted ...................... 1,310,796 1,452,499 1,485,591 1,457,686 1,405,486
(1)
Our net income for 2004 included gains related to sales of an investment of $314 million, net of tax, or $0.23 per basic share or $0.22 per
diluted share.
(2)
Our net income for 2005 included gains related to sales of an investment of $580 million, net of tax; a gain related to the divestiture of Yahoo!
China in connection with the Alibaba transaction of $205 million, net of tax; and a tax benefit of $248 million related to a subsidiary
restructuring transaction. In aggregate, these items had an impact of $1,033 million on net income, or $0.74 per basic share or $0.70 per
diluted share.
(3)
For the year ended December 31, 2006, as a result of adopting Statement of Financial Accounting Standard No. 123 (revised 2004), “Share-
Based Payment” (“SFAS 123R”), our income from operations was lower by $324 million and our net income was lower by $222 million, than
if we had continued to account for stock-based compensation under Accounting Principles Board (“APB”) Opinion No. 25, “Accounting for
Stock Issued to Employees” (“APB 25”). Basic and diluted net income per share for the year ended December 31, 2006 was $0.16 and $0.15
lower, respectively, than if the Company had continued to account for stock-based compensation under APB 25.
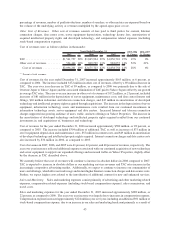
Consolidated Balance Sheets Data:
2003 2004 2005 2006 2007
(*)
December 31,
(In thousands)
Cash and cash equivalents ....... $ 415,892 $ 823,723 $ 1,429,693 $ 1,569,871 $ 1,513,930
Marketable debt securities ....... $2,150,323 $2,918,539 $ 2,570,155 $ 1,967,414 $ 849,542
Working capital ............... $1,013,913 $2,909,768 $ 2,245,481 $ 2,276,148 $ 937,274
Total assets .................. $5,931,654 $9,178,201 $10,831,834 $11,513,608 $12,229,741
Long-term liabilities ........... $ 822,890 $ 851,782 $ 1,061,367 $ 870,948 $ 384,208
Total stockholders’ equity ....... $4,363,490 $7,101,446 $ 8,566,415 $ 9,160,610 $ 9,532,831
(*)
As of December 31, 2007, our assets included an additional amount of goodwill of $978 million resulting from acquisitions closed in 2007.
As of December 31, 2007, our outstanding zero coupon senior convertible notes were classified as short-term debt and are reflected in
working capital. The zero coupon senior convertible notes were classified as long-term debt as of the end of each of the other fiscal years
presented.
35