Yahoo 2007 Annual Report Download - page 106
Download and view the complete annual report
Please find page 106 of the 2007 Yahoo annual report below. You can navigate through the pages in the report by either clicking on the pages listed below, or by using the keyword search tool below to find specific information within the annual report.-
 1
1 -
2
-
3
-
4
-
5
-
6
-
7
-
8
-
9
-
10
-
11
-
12
-
13
-
14
-
15
-
16
-
17
-
18
-
19
-
20
-
21
-
22
-
23
-
24
-
25
-
26
-
27
-
28
-
29
-
30
-
31
-
32
-
33
-
34
-
35
-
36
-
37
-
38
-
39
-
40
-
41
-
42
-
43
-
44
-
45
-
46
-
47
-
48
-
49
-
50
-
51
-
52
-
53
-
54
-
55
-
56
-
57
-
58
-
59
-
60
-
61
-
62
-
63
-
64
-
65
-
66
-
67
-
68
-
69
-
70
-
71
-
72
-
73
-
74
-
75
-
76
-
77
-
78
-
79
-
80
-
81
-
82
-
83
-
84
-
85
-
86
-
87
-
88
-
89
-
90
-
91
-
92
-
93
-
94
-
95
-
 96
96 -
 97
97 -
 98
98 -
 99
99 -
 100
100 -
 101
101 -
 102
102 -
 103
103 -
 104
104 -
 105
105 -
 106
106 -
 107
107 -
 108
108 -
 109
109 -
 110
110 -
 111
111 -
 112
112 -
 113
113 -
 114
114 -
 115
115 -
 116
116 -
117
-
118
-
119
-
120
-
121
-
122
-
123
-
124
-
125
-
126
-
127
-
128
-
129
-
130
-
131
-
132
-
133
-
134
-
135
-
136
-
137
-
138
-
139
-
140
-
141
-
142
-
143
-
144
-
145
-
146
-
147
-
148
-
149
-
150
-
151
-
152
-
153
-
154
-
155
-
156
 |
 |

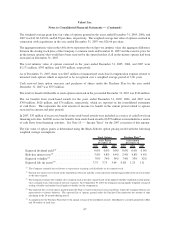
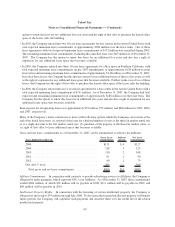
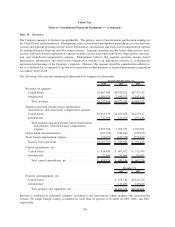
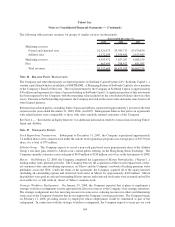
The following table presents revenues for groups of similar services (in thousands):
2005 2006 2007
Years Ended December 31,
Marketing services:
Owned and Operated sites ...................... $2,421,673 $3,070,715 $3,670,830
Affiliate sites ................................ 2,172,299 2,556,492 2,417,409
Marketing services .............................. 4,593,972 5,627,207 6,088,239
Fees ........................................ 663,696 798,472 881,035
Total revenues ............................... $5,257,668 $6,425,679 $6,969,274
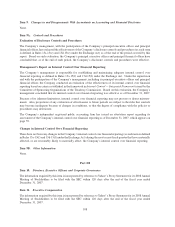
Note 16 RELATED PARTY TRANSACTIONS
The Company and other third parties are limited partners in Softbank Capital Partners LP (“Softbank Capital”), a
venture capital fund which is an affiliate of SOFTBANK. A Managing Partner of Softbank Capital is also a member
of the Company’s Board of Directors. The total investment by the Company in Softbank Capital is approximately
$36 million and represents less than a 5 percent holding in Softbank Capital. A significant portion of this investment
has been impaired by the Company, with the remaining value included on the consolidated balance sheets in other
assets. Pursuant to the Partnership Agreement, the Company invested on the same terms and on the same basis as all
other limited partners.
Revenue from related parties, excluding Yahoo! Japan and Alibaba, represented approximately 1 percent of the total
revenue in the years ended December 31, 2005, 2006, and 2007. Management believes that prices on agreements
with related parties were comparable to those with other similarly situated customers of the Company.
See Note 4 — “Investments in Equity Interests” for additional information related to transactions involving Yahoo!
Japan and Alibaba.
Note 17 SUBSEQUENT EVENTS
Stock Repurchase Transactions. Subsequent to December 31, 2007, the Company repurchased approximately
3.4 million shares of its common stock under the current stock repurchase program at an average price of $23.39 per
share, for a total of $79 million.
Alibaba Group. The Company expects to record a non-cash gain based on its proportionate share of the Alibaba
Group’s one-time gain related to Alibaba.com’s initial public offering on the Hong Kong Stock Exchange. The
Company currently estimates a non-cash gain of $450 million to $550 million, net of tax, in the first quarter of 2008.
Maven. On February 12, 2008, the Company completed the acquisition of Maven Networks Inc. (“Maven”), a
leading online video platform provider. The Company believes the acquisition of Maven will expand state-of-the-
art consumer video and advertising experiences on Yahoo! and the Company’s network of leading premium video
publishers across the Web. Under the terms of the agreement, the Company acquired all of the equity interests
(including all outstanding options and restricted stock units) in Maven for approximately $160 million. Maven
shareholders were paid in cash and outstanding Maven options and restricted stock units were assumed and will be
exercisable for, or will settle in, shares of Yahoo! common stock.
Strategic Workforce Realignment. On January 29, 2008, the Company reported that it plans to implement a
strategic workforce realignment to more appropriately allocate resources to the Company’s key strategic initiatives.
The strategic realignment involves investing resources in some areas, reducing resources in others and eliminating
some areas of the Company’s business that do not support the Company’s strategic priorities. The Company began,
on February 11, 2008, providing notices to employees whose employment would be terminated as part of the
realignment. In connection with the strategic workforce realignment, the Company expects to incur pre-tax cash
104
Yahoo! Inc.
Notes to Consolidated Financial Statements — (Continued)