Yahoo 2007 Annual Report Download - page 90
Download and view the complete annual report
Please find page 90 of the 2007 Yahoo annual report below. You can navigate through the pages in the report by either clicking on the pages listed below, or by using the keyword search tool below to find specific information within the annual report.-
 1
1 -
2
-
3
-
4
-
5
-
6
-
7
-
8
-
9
-
10
-
11
-
12
-
13
-
14
-
15
-
16
-
17
-
18
-
19
-
20
-
21
-
22
-
23
-
24
-
25
-
26
-
27
-
28
-
29
-
30
-
31
-
32
-
33
-
34
-
35
-
36
-
37
-
38
-
39
-
40
-
41
-
42
-
43
-
44
-
45
-
46
-
47
-
48
-
49
-
50
-
51
-
52
-
53
-
54
-
55
-
56
-
57
-
58
-
59
-
60
-
61
-
62
-
63
-
64
-
65
-
66
-
67
-
68
-
69
-
70
-
71
-
72
-
73
-
74
-
75
-
76
-
77
-
78
-
79
-
 80
80 -
 81
81 -
 82
82 -
 83
83 -
 84
84 -
 85
85 -
 86
86 -
 87
87 -
 88
88 -
 89
89 -
 90
90 -
 91
91 -
 92
92 -
 93
93 -
 94
94 -
 95
95 -
 96
96 -
 97
97 -
 98
98 -
 99
99 -
 100
100 -
101
-
102
-
103
-
104
-
105
-
106
-
107
-
108
-
109
-
110
-
111
-
112
-
113
-
114
-
115
-
116
-
117
-
118
-
119
-
120
-
121
-
122
-
123
-
124
-
125
-
126
-
127
-
128
-
129
-
130
-
131
-
132
-
133
-
134
-
135
-
136
-
137
-
138
-
139
-
140
-
141
-
142
-
143
-
144
-
145
-
146
-
147
-
148
-
149
-
150
-
151
-
152
-
153
-
154
-
155
-
156
 |
 |

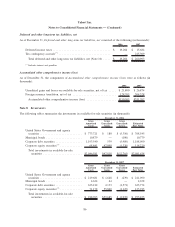
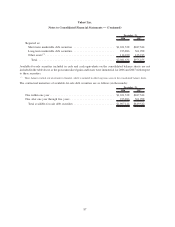
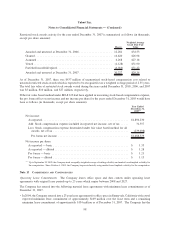
The following tables show all investments in an unrealized loss position for which an other-than-temporary
impairment has not been recognized and the related gross unrealized losses and fair value, aggregated by investment
category and length of time that individual securities have been in a continuous unrealized loss position (in
thousands):
Fair
Value
Unrealized
Loss
Fair
Value
Unrealized
Loss
Fair
Value
Unrealized
Loss
Less than 12 Months 12 Months or Greater Total
December 31, 2006
United States Government and
agency securities ......... $138,000 $ (223) $ 545,569 $ (5,133) $ 683,569 $ (5,356)
Municipal bonds ........... 2,029 (2) 6,147 (98) 8,176 (100)
Corporate debt securities ..... 514,183 (733) 527,485 (5,256) 1,041,668 (5,989)
Corporate equity securities .... — — 2,733 (1,320) 2,733 (1,320)
Total investments in
available-for-sale
securities ............. $654,212 $ (958) $1,081,934 $(11,807) $1,736,146 $(12,765)
Fair
Value
Unrealized
Loss
Fair
Value
Unrealized
Loss
Fair
Value
Unrealized
Loss
Less than 12 Months 12 Months or Greater Total
December 31, 2007
United States Government and
agency securities ......... $ 1,993 $ (19) $ 66,655 $ (220) $ 68,648 $ (239)
Municipal bonds ........... — — — — — —
Corporate debt securities ..... 113,328 (646) 237,581 (925) 350,909 (1,571)
Corporate equity securities .... 867 (1,125) — — 867 (1,125)
Total investments in
available-for-sale
securities ............. $116,188 $(1,790) $ 304,236 $ (1,145) $ 420,424 $ (2,935)
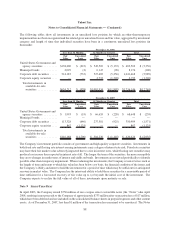
The Company’s investment portfolio consists of government and high-quality corporate securities. Investments in
both fixed rate and floating rate interest earning instruments carry a degree of interest rate risk. Fixed rate securities
may have their fair market value adversely impacted due to a rise in interest rates, while floating rate securities may
produce less income than expected in interest rates fall. The longer the term of the securities, the more susceptible
they are to changes in market rates of interest and yields on bonds. Investments are reviewed periodically to identify
possible other-than-temporary impairment. When evaluating the investments, the Company reviews factors such as
the length of time and extent to which fair value has been below cost basis, the financial condition of the issuer, and
the Company’s ability and intent to hold the investment for a period of time which may be sufficient for anticipated
recovery in market value. The Company has the intent and ability to hold these securities for a reasonable period of
time sufficient for a forecasted recovery of fair value up to (or beyond) the initial cost of the investment. The
Company expects to realize the full value of all of these investments upon maturity or sale.
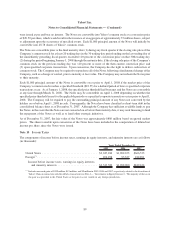
Note 9 SHORT-TERM DEBT
In April 2003, the Company issued $750 million of zero coupon senior convertible notes (the “Notes”) due April
2008, resulting in net proceeds to the Company of approximately $733 million after transaction fees of $17 million,
which have been deferred and are included on the consolidated balance sheets in prepaid expenses and other current
assets. As of December 31, 2007, less than $1 million of the transaction fees remained to be amortized. The Notes
88
Yahoo! Inc.
Notes to Consolidated Financial Statements — (Continued)