Yahoo 2007 Annual Report Download - page 40
Download and view the complete annual report
Please find page 40 of the 2007 Yahoo annual report below. You can navigate through the pages in the report by either clicking on the pages listed below, or by using the keyword search tool below to find specific information within the annual report.-
 1
1 -
2
-
3
-
4
-
5
-
6
-
7
-
8
-
9
-
10
-
11
-
12
-
13
-
14
-
15
-
16
-
17
-
18
-
19
-
20
-
21
-
22
-
23
-
24
-
25
-
26
-
27
-
28
-
29
-
 30
30 -
 31
31 -
 32
32 -
 33
33 -
 34
34 -
 35
35 -
 36
36 -
 37
37 -
 38
38 -
 39
39 -
 40
40 -
 41
41 -
 42
42 -
 43
43 -
 44
44 -
 45
45 -
 46
46 -
 47
47 -
 48
48 -
 49
49 -
 50
50 -
51
-
52
-
53
-
54
-
55
-
56
-
57
-
58
-
59
-
60
-
61
-
62
-
63
-
64
-
65
-
66
-
67
-
68
-
69
-
70
-
71
-
72
-
73
-
74
-
75
-
76
-
77
-
78
-
79
-
80
-
81
-
82
-
83
-
84
-
85
-
86
-
87
-
88
-
89
-
90
-
91
-
92
-
93
-
94
-
95
-
96
-
97
-
98
-
99
-
100
-
101
-
102
-
103
-
104
-
105
-
106
-
107
-
108
-
109
-
110
-
111
-
112
-
113
-
114
-
115
-
116
-
117
-
118
-
119
-
120
-
121
-
122
-
123
-
124
-
125
-
126
-
127
-
128
-
129
-
130
-
131
-
132
-
133
-
134
-
135
-
136
-
137
-
138
-
139
-
140
-
141
-
142
-
143
-
144
-
145
-
146
-
147
-
148
-
149
-
150
-
151
-
152
-
153
-
154
-
155
-
156
 |
 |
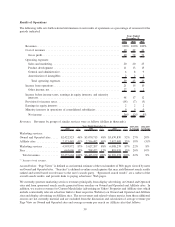
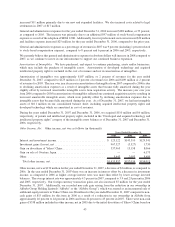
network of Affiliates. Marketing services and fees revenues experienced 8 percent and 10 percent year over year
growth, respectively.
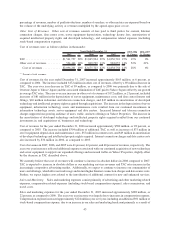
Our revenues for the year ended December 31, 2007 increased 8 percent year over year to approximately
$7.0 billion, with fee paying users up 17 percent year over year, and Page Views up 11 percent year over year.
Operating income for the year ended December 31, 2007 declined by $246 million. The decline reflects year over
year increases in operating expenses of $626 million offset by the impact of additional margin related to year over
year revenue growth.
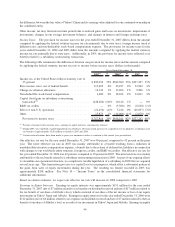
Cash generated from our operations is a measure of the cash productivity of our business model and is an area of
focus for us. Our operating activities in 2007 generated adequate cash to meet our operating needs. Cash used in
investing activities in 2007 included capital expenditures of $602 million, as well as cash consideration for
acquisitions of $974 million, offset by the sale of marketable debt securities. Cash used in financing activities in
2007 reflected our net cash used for direct and structured stock repurchases of $1.8 billion, offset by cash proceeds
from the issuance of common stock of $375 million as a result of the exercise of employee stock options.
During 2007, we determined that income tax benefits of $127 million ($92 million related to 2006 and the
remainder related to earlier years) should not have been recorded to additional paid-in capital as tax benefits from
stock-based awards because for financial statement ordering purposes, the tax benefits should have been attributed
to the utilization of acquired net operating losses first or should not have been recognized at all because the
underlying tax amounts should not have been offset by tax benefits from stock-based awards. As a result, in the
2007 statement of cash flows, we reduced by $92 million, excess tax benefits from stock-based awards recorded in
cash flows from operating activities with an equivalent reduction to the amount of excess tax benefits recorded in
cash flows from financing activities. This reclassification had no impact on overall cash flows. The amounts that
impacted income tax expense and earnings in equity interests also increased diluted earnings per share by $0.01 for
the year ended December 31, 2007. We believe that the aforementioned amounts are not material to reported
amounts for 2007, 2006, or earlier years and therefore we have corrected them in the 2007 consolidated financial
statements. See Note 10 — “Income Taxes” in the consolidated financial statements for additional information.
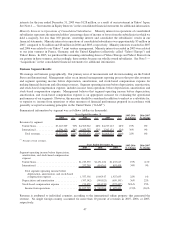
Summary
We believe the search queries, Page Views, click-throughs, and the related marketing services and fees revenues that
we generate correlate to the number and activity level of users across our offerings on Yahoo! Properties and the
activity level on our Affiliate sites. In the fourth quarter of 2006, we launched a new search marketing system,
referred to as Project Panama, and we have completed our migration plan for our active advertisers worldwide onto
the new system. We believe the new search marketing system, including the new ranking model which was
launched in all of our major domestic and international markets in 2007, in addition to ongoing enhancements in
which we are investing, enables us to provide a more relevant search experience to users, more valuable customer
leads to advertisers, and additional opportunities to our Affiliate and distribution partners. By providing a platform
for our users that brings together our search technology, content, and community while allowing for personalization
and integration across devices, we seek to become more essential to, increase our share of, and deepen the
engagement of, our users with our products and services. We believe this deeper engagement of new and existing
users and our new search marketing system, coupled with the growth of the Internet as an advertising medium will
enable us to increase our revenues in 2008.
In the following Management’s Discussion and Analysis, we discuss the following areas of our financial results:
• Results of Operations;
• Business Segment Results;
• Transactions;
• Liquidity and Capital Resources;
• Critical Accounting Policies and Estimates; and
• Recent Accounting Pronouncements.
38