Yahoo 2007 Annual Report Download - page 43
Download and view the complete annual report
Please find page 43 of the 2007 Yahoo annual report below. You can navigate through the pages in the report by either clicking on the pages listed below, or by using the keyword search tool below to find specific information within the annual report.-
 1
1 -
2
-
3
-
4
-
5
-
6
-
7
-
8
-
9
-
10
-
11
-
12
-
13
-
14
-
15
-
16
-
17
-
18
-
19
-
20
-
21
-
22
-
23
-
24
-
25
-
26
-
27
-
28
-
29
-
30
-
31
-
32
-
 33
33 -
 34
34 -
 35
35 -
 36
36 -
 37
37 -
 38
38 -
 39
39 -
 40
40 -
 41
41 -
 42
42 -
 43
43 -
 44
44 -
 45
45 -
 46
46 -
 47
47 -
 48
48 -
 49
49 -
 50
50 -
 51
51 -
 52
52 -
 53
53 -
54
-
55
-
56
-
57
-
58
-
59
-
60
-
61
-
62
-
63
-
64
-
65
-
66
-
67
-
68
-
69
-
70
-
71
-
72
-
73
-
74
-
75
-
76
-
77
-
78
-
79
-
80
-
81
-
82
-
83
-
84
-
85
-
86
-
87
-
88
-
89
-
90
-
91
-
92
-
93
-
94
-
95
-
96
-
97
-
98
-
99
-
100
-
101
-
102
-
103
-
104
-
105
-
106
-
107
-
108
-
109
-
110
-
111
-
112
-
113
-
114
-
115
-
116
-
117
-
118
-
119
-
120
-
121
-
122
-
123
-
124
-
125
-
126
-
127
-
128
-
129
-
130
-
131
-
132
-
133
-
134
-
135
-
136
-
137
-
138
-
139
-
140
-
141
-
142
-
143
-
144
-
145
-
146
-
147
-
148
-
149
-
150
-
151
-
152
-
153
-
154
-
155
-
156
 |
 |
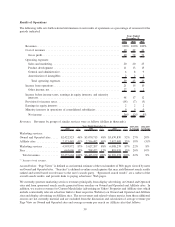
offerings, including our enhanced algorithmic search technology, contribute to our growing number of users. As
our user base increases, we process a higher number of search queries and generate a higher number of Page Views.
We also believe that our growing audience of users make Yahoo! Properties more attractive to advertisers and
increases their spending on marketing services. Further, we believe the growth in users on Yahoo! Properties and on
the Internet overall reflects the increasing acceptance, importance, and dependence of users on the Internet. As a
result of this growth in the online audience, we believe advertisers are shifting a greater percentage of their spending
from traditional media to the Internet to reach this growing audience.
We currently expect marketing services revenues on our Owned and Operated sites to increase in absolute dollars
for 2008 compared to 2007 as we seek to increase marketing services revenues on Yahoo! Properties by providing a
more relevant search experience to users, providing more relevant and valuable customer leads to advertisers from
our new search marketing system, and improving our technologies to expand and improve our offerings.
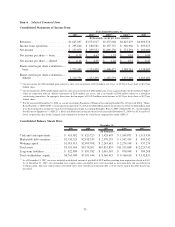
Marketing Services Revenues from Affiliate Sites. Marketing services revenues from Affiliate sites for the year
ended December 31, 2007 decreased $139 million, or 5 percent, as compared to 2006. Marketing services revenues
from Affiliate sites for the year ended December 31, 2006 increased $385 million, or 18 percent, as compared to
2005.
As more inventory becomes available on the Web it has, and will continue to make, the Affiliate business more
competitive; consequently, our portion of revenue share from Affiliate sites is declining. We expect this trend to
continue in 2008. However, we also expect to experience some favorable impact from our off-network display
initiatives. While this display business is still relatively small, we expect continued growth as our major
partnerships gain momentum.
The number of searches on Affiliate sites increased by approximately 1 percent for the year ended December 31,
2007, as compared to 2006. The number of searches on Affiliate sites increased by approximately 28 percent for the
year ended December 31, 2006, as compared to 2005. The increase in the volume of searches is primarily attributed
to the net increase in the number of Affiliates.
The average revenue per search on our Affiliate sites decreased by 5 percent for the year ended December 31, 2007,
as compared to 2006. The average revenue per search on our Affiliate sites decreased by 9 percent for the year
ended December 31, 2006, as compared to 2005. The decline in average revenues per search is primarily as a result
of a decline in revenues from certain Affiliate sites.
Additionally, during the third quarter of 2007 we sold Overture Japan to Yahoo! Japan. As part of this transaction
we also entered into a commercial arrangement with Yahoo! Japan in which we provide advertising and search
marketing services to Yahoo! Japan for a service fee. This arrangement began on September 1, 2007 and, beginning
on that date, we commenced recording marketing services revenues from Yahoo! Japan for the provision of search
marketing services based on a percentage of advertising revenues earned by Yahoo! Japan for the delivery of
sponsored search results. The sale of Overture Japan to Yahoo! Japan negatively impacted our net revenues from
Affiliate sites by 1 percent for 2007.
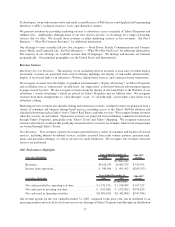
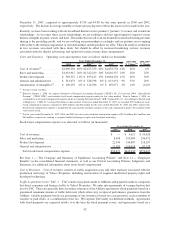
Fees Revenues. For the year ended December 31, 2007, fees revenues increased approximately $83 million, or
10 percent, as compared to 2006. The year over year growth is associated with an increase in the number of paying
users for our fee-based services, which numbered 19.0 million as of December 31, 2007, compared to 16.3 million
as of December 31, 2006, an increase of 17 percent. The impact of this increase in our number of paying users was
offset by a reduction in the average monthly revenues per paying user as discussed below. For the year ended
December 31, 2006, fees revenues increased approximately $135 million, or 20 percent, as compared to 2005. The
year over year growth in 2006 as compared to 2005 is associated with an increase in the number of paying users for
our fee-based services, which numbered 16.3 million as of December 31, 2006, compared to 12.6 million as of
December 31, 2005, an increase of 29 percent. The impact of this increase in our number of paying users was offset
by a reduction in the average monthly revenues per paying user discussed below.
Our increased base of paying users grew across most of our offerings. Our fee-based services include Internet
broadband services, sports, music, games, personals, and premium mail offerings, as well as our services for small
businesses. Average monthly revenues per paying user decreased to approximately $3.00 for the year ended
41