Yahoo 2007 Annual Report Download - page 48
Download and view the complete annual report
Please find page 48 of the 2007 Yahoo annual report below. You can navigate through the pages in the report by either clicking on the pages listed below, or by using the keyword search tool below to find specific information within the annual report.-
 1
1 -
2
-
3
-
4
-
5
-
6
-
7
-
8
-
9
-
10
-
11
-
12
-
13
-
14
-
15
-
16
-
17
-
18
-
19
-
20
-
21
-
22
-
23
-
24
-
25
-
26
-
27
-
28
-
29
-
30
-
31
-
32
-
33
-
34
-
35
-
36
-
37
-
 38
38 -
 39
39 -
 40
40 -
 41
41 -
 42
42 -
 43
43 -
 44
44 -
 45
45 -
 46
46 -
 47
47 -
 48
48 -
 49
49 -
 50
50 -
 51
51 -
 52
52 -
 53
53 -
 54
54 -
 55
55 -
 56
56 -
 57
57 -
 58
58 -
59
-
60
-
61
-
62
-
63
-
64
-
65
-
66
-
67
-
68
-
69
-
70
-
71
-
72
-
73
-
74
-
75
-
76
-
77
-
78
-
79
-
80
-
81
-
82
-
83
-
84
-
85
-
86
-
87
-
88
-
89
-
90
-
91
-
92
-
93
-
94
-
95
-
96
-
97
-
98
-
99
-
100
-
101
-
102
-
103
-
104
-
105
-
106
-
107
-
108
-
109
-
110
-
111
-
112
-
113
-
114
-
115
-
116
-
117
-
118
-
119
-
120
-
121
-
122
-
123
-
124
-
125
-
126
-
127
-
128
-
129
-
130
-
131
-
132
-
133
-
134
-
135
-
136
-
137
-
138
-
139
-
140
-
141
-
142
-
143
-
144
-
145
-
146
-
147
-
148
-
149
-
150
-
151
-
152
-
153
-
154
-
155
-
156
 |
 |

the difference between the fair value of Yahoo! China and its carrying value adjusted for our continued ownership in
the combined entity.
Other income, net may fluctuate in future periods due to realized gains and losses on investments, impairments of
investments, changes in our average investment balances, and changes in interest and foreign exchange rates.
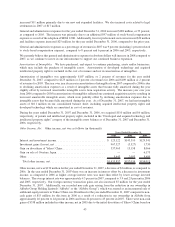
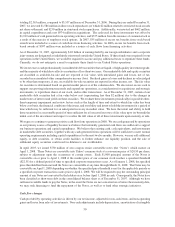
Income Taxes. The provision for income taxes for the year ended December 31, 2007 differs from the amount
computed by applying the federal statutory income tax rate primarily due to state taxes, foreign income taxed at
different rates, and non-deductible stock-based compensation expense. The provisions for income taxes for the
years ended December 31, 2006 and 2005 differ from the amounts computed by applying the federal statutory
income tax rate primarily due to state taxes. Additionally, in 2005, the provision for income taxes reflected a tax
benefit related to a subsidiary restructuring transaction.
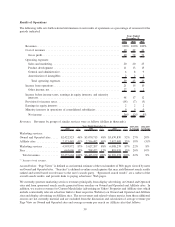
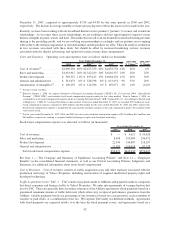
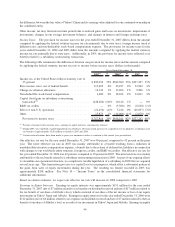
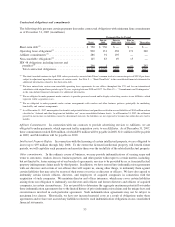
The following table summarizes the differences between our provision for income taxes and the amount computed
by applying the federal statutory income tax rate to income before income taxes (dollars in thousands):
2005
(3) (1)
2006
(3) (1)
2007
(1)
Years Ended December 31,
Income tax at the United States federal statutory rate of
35 percent .................................. $890,254 35% $384,300 35% $297,297 35%
State income taxes, net of federal benefit ............. 113,685 4% 43,297 4% 32,942 4%
Change in valuation allowance ..................... 16,342 1% 15,206 1% 9,806 1%
Non-deductible stock-based compensation ............ 1,400 0% 18,652 2% 34,011 4%
Capital (loss)/gain on subsidiary restructuring
transaction
(2)
................................ (248,284) (10)% 10,616 1% — 0%
R&D tax credits................................ — 0% (5,300) 0% (8,618) (1)%
Effect of non-U.S. operations ...................... (21,454) (1)% 5,246 0% (26,097) (3)%
Other........................................ 15,873 1% (14,006) (1)% (2,078) 0%
Provision for income taxes ...................... $767,816 30% $458,011 42% $337,263 40%
(1)
Percent of income before income taxes, earnings in equity interests, and minority interests.
(2)
During 2005, we completed a taxable liquidation of a subsidiary. The transaction gave rise to a capital loss for tax purposes, resulting in a net
tax benefit of approximately $238 million recorded in 2005 and 2006.
(3)
Certain reclassifications have been made to prior year amounts in order to conform to the current year presentation.
Our effective tax rate for the year ended December 31, 2007 was 40 percent, compared to 42 percent in the prior
year. The lower effective tax rate in 2007 was mainly attributable to a benefit resulting from a reduction in
nondeductible executive compensation expense, a benefit due to the release of deferred tax liabilities in connection
with changes to our worldwide entity structure, foreign tax credits, and R&D tax credits. Our effective tax rate for
the year ended December 31, 2006 was 42 percent, compared to 30 percent in 2005. The increased rate was mainly
attributable to the tax benefit related to a subsidiary restructuring transaction in 2005. As part of our ongoing efforts
to streamline our operational structure, we completed a taxable liquidation of a subsidiary in 2005 that we acquired
several years ago. This transaction gave rise to a capital loss for tax purposes, which offset a substantial portion of
the gains from sales of equity investments during the year. The resulting tax benefit recorded in 2005 was
approximately $248 million. See Note 10 — “Income Taxes” in the consolidated financial statements for
additional information.
Based on current estimates, we expect our effective tax rate will increase in 2008 compared to 2007.
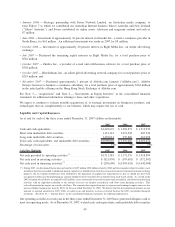
Earnings in Equity Interests. Earnings in equity interests was approximately $151 million for the year ended
December 31, 2007 (net of $7 million related to tax benefits on dividends received and net of $17 million related to
the tax benefit of our share of Alibaba’s loss), which consisted of our share of the net income or loss of our equity
investments in Yahoo! Japan and Alibaba. Earnings in equity interests for the year ended December 31, 2006 were
$112 million (net of $6 million related to tax expense on dividends received and net of $7 million related to the tax
benefit of our share of Alibaba’s loss) as a result of our investment in Yahoo! Japan and Alibaba. Earnings in equity
46