Yahoo 2007 Annual Report Download - page 41
Download and view the complete annual report
Please find page 41 of the 2007 Yahoo annual report below. You can navigate through the pages in the report by either clicking on the pages listed below, or by using the keyword search tool below to find specific information within the annual report.-
 1
1 -
2
-
3
-
4
-
5
-
6
-
7
-
8
-
9
-
10
-
11
-
12
-
13
-
14
-
15
-
16
-
17
-
18
-
19
-
20
-
21
-
22
-
23
-
24
-
25
-
26
-
27
-
28
-
29
-
30
-
 31
31 -
 32
32 -
 33
33 -
 34
34 -
 35
35 -
 36
36 -
 37
37 -
 38
38 -
 39
39 -
 40
40 -
 41
41 -
 42
42 -
 43
43 -
 44
44 -
 45
45 -
 46
46 -
 47
47 -
 48
48 -
 49
49 -
 50
50 -
 51
51 -
52
-
53
-
54
-
55
-
56
-
57
-
58
-
59
-
60
-
61
-
62
-
63
-
64
-
65
-
66
-
67
-
68
-
69
-
70
-
71
-
72
-
73
-
74
-
75
-
76
-
77
-
78
-
79
-
80
-
81
-
82
-
83
-
84
-
85
-
86
-
87
-
88
-
89
-
90
-
91
-
92
-
93
-
94
-
95
-
96
-
97
-
98
-
99
-
100
-
101
-
102
-
103
-
104
-
105
-
106
-
107
-
108
-
109
-
110
-
111
-
112
-
113
-
114
-
115
-
116
-
117
-
118
-
119
-
120
-
121
-
122
-
123
-
124
-
125
-
126
-
127
-
128
-
129
-
130
-
131
-
132
-
133
-
134
-
135
-
136
-
137
-
138
-
139
-
140
-
141
-
142
-
143
-
144
-
145
-
146
-
147
-
148
-
149
-
150
-
151
-
152
-
153
-
154
-
155
-
156
 |
 |

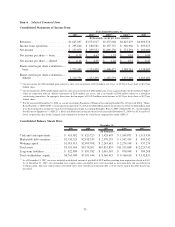
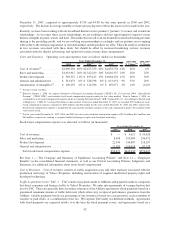
Results of Operations
The following table sets forth selected information on our results of operations as a percentage of revenues for the
periods indicated:
2005 2006 2007
Years Ended
December 31,
Revenues. . . .................................................. 100% 100% 100%
Cost of revenues ............................................... 40 42 41
Gross profit ................................................. 60 58 59
Operating expenses:
Sales and marketing ........................................... 20 20 23
Product development .......................................... 11 13 15
General and administrative ...................................... 6 8 9
Amortization of intangibles ..................................... 2 2 2
Total operating expenses ...................................... 39 43 49
Income from operations .......................................... 21 15 10
Other income, net ............................................ 27 2 2
Income before income taxes, earnings in equity interests, and minority
interests . . .................................................. 48 17 12
Provision for income taxes ........................................ (14) (7) (5)
Earnings in equity interests ....................................... 2 2 2
Minority interests in operations of consolidated subsidiaries ............... 0 0 0
Net income ................................................. 36% 12% 9%
Revenues. Revenues by groups of similar services were as follows (dollars in thousands):
2005
(*)
2006
(*)
2007
(*)
2005-2006
% Change
2006-2007
% Change
Years Ended December 31,
Marketing services:
Owned and Operated sites ..... $2,422,523 46% $3,070,715 48% $3,670,830 52% 27% 20%
Affiliate sites .............. 2,171,449 41% 2,556,492 40% 2,417,409 35% 18% (5)%
Marketing services .......... 4,593,972 87% 5,627,207 88% 6,088,239 87% 22% 8%
Fees ..................... 663,696 13% 798,472 12% 881,035 13% 20% 10%
Total revenues ............ $5,257,668 100% $6,425,679 100% $6,969,274 100% 22% 8%
(*)
Percent of total revenues.
As used below, “Page Views” is defined as our internal estimate of the total number of Web pages viewed by users
on Owned and Operated sites. “Searches” is defined as online search queries that may yield Internet search results
ranked and sorted based on relevance to the user’s search query. “Sponsored search results” are a subset of the
overall search results, and provide links to paying advertisers’ Web pages.
We currently generate marketing services revenues principally from display advertising on Owned and Operated
sites and from sponsored search results generated from searches on Owned and Operated and Affiliate sites. In
addition, we receive revenues for Content Match links (advertising on Yahoo! Properties and Affiliate sites which
include contextually relevant advertiser links to their respective Websites) on Owned and Operated and Affiliate
sites and display advertising on Affiliate sites. The net revenues and related volume metrics from these additional
sources are not currently material and are excluded from the discussion and calculation of average revenue per
Page View on Owned and Operated sites and average revenue per search on Affiliate sites that follows.
39