Yahoo 2007 Annual Report Download - page 45
Download and view the complete annual report
Please find page 45 of the 2007 Yahoo annual report below. You can navigate through the pages in the report by either clicking on the pages listed below, or by using the keyword search tool below to find specific information within the annual report.-
 1
1 -
2
-
3
-
4
-
5
-
6
-
7
-
8
-
9
-
10
-
11
-
12
-
13
-
14
-
15
-
16
-
17
-
18
-
19
-
20
-
21
-
22
-
23
-
24
-
25
-
26
-
27
-
28
-
29
-
30
-
31
-
32
-
33
-
34
-
 35
35 -
 36
36 -
 37
37 -
 38
38 -
 39
39 -
 40
40 -
 41
41 -
 42
42 -
 43
43 -
 44
44 -
 45
45 -
 46
46 -
 47
47 -
 48
48 -
 49
49 -
 50
50 -
 51
51 -
 52
52 -
 53
53 -
 54
54 -
 55
55 -
56
-
57
-
58
-
59
-
60
-
61
-
62
-
63
-
64
-
65
-
66
-
67
-
68
-
69
-
70
-
71
-
72
-
73
-
74
-
75
-
76
-
77
-
78
-
79
-
80
-
81
-
82
-
83
-
84
-
85
-
86
-
87
-
88
-
89
-
90
-
91
-
92
-
93
-
94
-
95
-
96
-
97
-
98
-
99
-
100
-
101
-
102
-
103
-
104
-
105
-
106
-
107
-
108
-
109
-
110
-
111
-
112
-
113
-
114
-
115
-
116
-
117
-
118
-
119
-
120
-
121
-
122
-
123
-
124
-
125
-
126
-
127
-
128
-
129
-
130
-
131
-
132
-
133
-
134
-
135
-
136
-
137
-
138
-
139
-
140
-
141
-
142
-
143
-
144
-
145
-
146
-
147
-
148
-
149
-
150
-
151
-
152
-
153
-
154
-
155
-
156
 |
 |

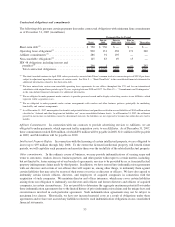
percentage of revenues, number of paid introductions, number of searches, or other metrics are expensed based on
the volume of the underlying activity or revenues multiplied by the agreed-upon price or rate.
Other Cost of Revenues. Other cost of revenues consists of fees paid to third parties for content, Internet
connection charges, data center costs, server equipment depreciation, technology license fees, amortization of
acquired intellectual property rights and developed technology, and compensation related expenses (including
stock-based compensation expense).
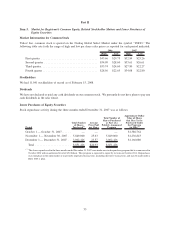
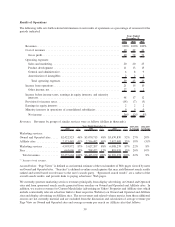
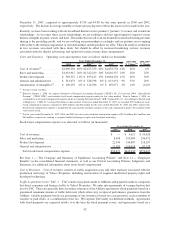
Cost of revenues were as follows (dollars in thousands):
2005
(*)
2006
(*)
2007
(*)
2005-2006
% Change
2006-2007
% Change
Years Ended December 31,
TAC...................... $1,561,737 30% $1,865,924 29% $1,856,701 27% 19% 0%
Other cost of revenues ......... 534,464 10% 809,799 13% 982,057 14% 52% 21%
Cost of revenues ........... $2,096,201 40% $2,675,723 42% $2,838,758 41% 28% 6%
(*)
Percent of total revenues.
Cost of revenues for the year ended December 31, 2007 increased approximately $163 million, or 6 percent, as
compared to 2006. The increase included $172 million in other cost of revenues, offset by a $9 million decrease in
TAC. The year over year decrease in TAC of $9 million, as compared to 2006 was primarily due to the sale of
Overture Japan to Yahoo! Japan (and the associated elimination of TAC paid to Yahoo! Japan) offset by our growth
in average TAC rates. The year over year increase in other cost of revenues of $172 million, or 21 percent, included
increases of $81 million in the depreciation of server equipment, maintenance costs, and data center fixtures and
fittings, $26 million in Internet and telecom connection charges, and $45 million in amortization of developed
technology and intellectual property rights acquired through acquisitions. The increase in the depreciation of server
equipment, information technology assets and maintenance costs resulted from our continued investments in
information technology assets, server equipment and data centers. Increased Internet and telecom connection
charges supported our growing audience of users, traffic, and new offerings on Yahoo! Properties. The increase in
the amortization of developed technology and intellectual property rights acquired resulted from our continued
investments in, and acquisitions of, businesses and technology.
Cost of revenues for the year ended December 31, 2006 increased approximately $580 million, or 28 percent, as
compared to 2005. The increase included $304 million of additional TAC, as well as increases of $75 million in
server equipment depreciation and maintenance costs, $55 million in content costs, and $49 million in amortization
of developed technology and intellectual property rights acquired. Internet connection charges and data center costs
also increased by $36 million in 2006, as compared to 2005.
Cost of revenues in 2007, 2006, and 2005 were 41 percent, 42 percent, and 40 percent of revenues, respectively. The
year over year increases reflected additional expenses associated with our continued acquisition of new technology
and server equipment to support our expanded offerings and increased traffic on Yahoo! Properties, slightly offset
by the decrease in TAC described above.
We currently believe that cost of revenues will continue to increase in absolute dollars in 2008 compared to 2007.
TAC is expected to increase in absolute dollars as our marketing services revenues and TAC rates increase in the
increasingly competitive advertising market. Additionally, we expect to continue to increase our communities of
users and offerings, which drive network usage and in turn higher Internet connection charges and data center costs.
Further, we expect higher costs related to the introduction of additional content for new and enhanced services.
Sales and Marketing. Sales and marketing expenses consist primarily of advertising and other marketing related
expenses, compensation related expenses (including stock-based compensation expense), sales commissions, and
travel costs.
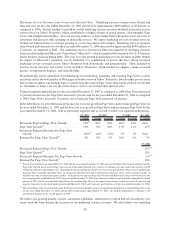
Sales and marketing expenses for the year ended December 31, 2007 increased approximately $288 million, or
22 percent, as compared to 2006. The year over year increase was largely due to increases in compensation expense.
Compensation expense increased approximately $224 million year over year, including an additional $91 million of
stock-based compensation expense, due to an increase in our sales and marketing headcount primarily as a result of
43