Yahoo 2007 Annual Report Download - page 39
Download and view the complete annual report
Please find page 39 of the 2007 Yahoo annual report below. You can navigate through the pages in the report by either clicking on the pages listed below, or by using the keyword search tool below to find specific information within the annual report.-
 1
1 -
2
-
3
-
4
-
5
-
6
-
7
-
8
-
9
-
10
-
11
-
12
-
13
-
14
-
15
-
16
-
17
-
18
-
19
-
20
-
21
-
22
-
23
-
24
-
25
-
26
-
27
-
28
-
 29
29 -
 30
30 -
 31
31 -
 32
32 -
 33
33 -
 34
34 -
 35
35 -
 36
36 -
 37
37 -
 38
38 -
 39
39 -
 40
40 -
 41
41 -
 42
42 -
 43
43 -
 44
44 -
 45
45 -
 46
46 -
 47
47 -
 48
48 -
 49
49 -
50
-
51
-
52
-
53
-
54
-
55
-
56
-
57
-
58
-
59
-
60
-
61
-
62
-
63
-
64
-
65
-
66
-
67
-
68
-
69
-
70
-
71
-
72
-
73
-
74
-
75
-
76
-
77
-
78
-
79
-
80
-
81
-
82
-
83
-
84
-
85
-
86
-
87
-
88
-
89
-
90
-
91
-
92
-
93
-
94
-
95
-
96
-
97
-
98
-
99
-
100
-
101
-
102
-
103
-
104
-
105
-
106
-
107
-
108
-
109
-
110
-
111
-
112
-
113
-
114
-
115
-
116
-
117
-
118
-
119
-
120
-
121
-
122
-
123
-
124
-
125
-
126
-
127
-
128
-
129
-
130
-
131
-
132
-
133
-
134
-
135
-
136
-
137
-
138
-
139
-
140
-
141
-
142
-
143
-
144
-
145
-
146
-
147
-
148
-
149
-
150
-
151
-
152
-
153
-
154
-
155
-
156
 |
 |

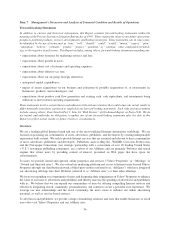
To developers, we provide an innovative and easily accessible array of Web Services and Application Programming
Interfaces (“APIs”), technical resources, tools, and channels to market.
We generate revenues by providing marketing services to advertisers across a majority of Yahoo! Properties and
Affiliate sites. Additionally, although many of our user services are free, we do charge for a range of premium
services that we offer. We classify these revenues as either marketing services or fees revenues. See Part I
Business — “How We Generate Revenues” for additional information.
Our offerings to users currently fall into five categories — Front Doors; Search; Communications and Commu-
nities; Media; and Connected Life. See Part I Business — “What We Offer Our Users” for additional information.
The majority of our offerings are available in more than 20 languages. We manage and measure our business
geographically. Our principal geographies are the United States and International.
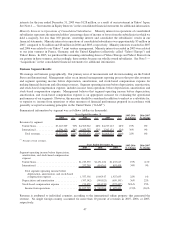
Revenue Sources
Marketing Services Revenues. The majority of our marketing services revenues is from sales of online display
advertising; revenues are generated from several offerings including: the display of rich media advertisements,
display of text-based links to an advertiser’s Website, listing-based services, and commerce-based transactions.
We recognize revenues from the display of graphical advertisements (“display advertising”) on Yahoo! Properties
and on Affiliate sites as “impressions” are delivered. An “impression” is delivered when an advertisement appears
in pages viewed by users. We also recognize revenues from the display of text-based links to the Websites of our
advertisers (“search advertising”) which are placed on Yahoo! Properties and on Affiliate sites. We recognize
revenues from these arrangements as “click-throughs” occur. A “click-through” occurs when a user clicks on an
advertiser’s listing.
Marketing services revenues also includes listings and transaction revenues. Listings revenues are generated from a
variety of consumer and business listings-based services, including access to the Yahoo! HotJobs database and
classified advertising such as Yahoo! Autos, Yahoo! Real Estate, and other services. We recognize listings revenues
when the services are performed. Transaction revenues are generated from facilitating commercial transactions
through Yahoo! Properties, principally from Yahoo! Travel and Yahoo! Shopping. We recognize transaction
revenues when there is evidence that qualifying transactions have occurred, for example, when travel arrangements
are booked through Yahoo! Travel.
Fees Revenues. Fees revenues consists of revenues generated from a variety of consumer and business fee-based
services, including Internet broadband services, royalties received from joint venture partners, premium mail,
music and personals offerings, as well as services for small businesses. We recognize fees revenues when the
services are performed.
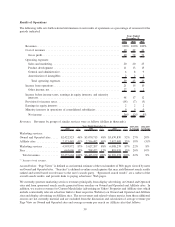
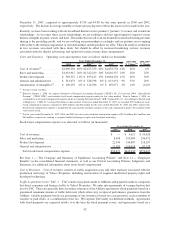
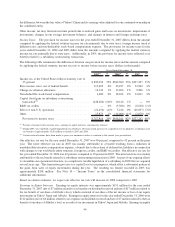
2007 Performance Highlights
Operating Highlights 2006 2007
2006-2007
Change
Years Ended December 31,
(In thousands)
Revenues ..................................... $6,425,679 $6,969,274 $ 543,595
Income from operations ........................... $ 940,966 $ 695,413 $(245,553)
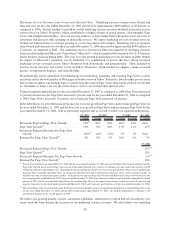
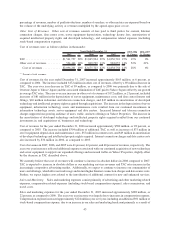
Cash Flow Highlights 2006 2007
2006-2007
Change
Years Ended December 31,
(In thousands)
Net cash provided by operating activities ............. $1,371,576 $ 1,918,899 $ 547,323
Net cash used in investing activities................. $ (193,681) $ (572,502) $(378,821)
Net cash used in financing activities ................ $(1,094,624) $(1,442,008) $(347,384)
Our revenue growth for the year ended December 31, 2007, compared to the prior year, can be attributed to an
increasing number and activity level of users across our offerings on Yahoo! Properties and through our distribution
37