Yahoo 2007 Annual Report Download - page 58
Download and view the complete annual report
Please find page 58 of the 2007 Yahoo annual report below. You can navigate through the pages in the report by either clicking on the pages listed below, or by using the keyword search tool below to find specific information within the annual report.-
 1
1 -
2
-
3
-
4
-
5
-
6
-
7
-
8
-
9
-
10
-
11
-
12
-
13
-
14
-
15
-
16
-
17
-
18
-
19
-
20
-
21
-
22
-
23
-
24
-
25
-
26
-
27
-
28
-
29
-
30
-
31
-
32
-
33
-
34
-
35
-
36
-
37
-
38
-
39
-
40
-
41
-
42
-
43
-
44
-
45
-
46
-
47
-
 48
48 -
 49
49 -
 50
50 -
 51
51 -
 52
52 -
 53
53 -
 54
54 -
 55
55 -
 56
56 -
 57
57 -
 58
58 -
 59
59 -
 60
60 -
 61
61 -
 62
62 -
 63
63 -
 64
64 -
 65
65 -
 66
66 -
 67
67 -
 68
68 -
69
-
70
-
71
-
72
-
73
-
74
-
75
-
76
-
77
-
78
-
79
-
80
-
81
-
82
-
83
-
84
-
85
-
86
-
87
-
88
-
89
-
90
-
91
-
92
-
93
-
94
-
95
-
96
-
97
-
98
-
99
-
100
-
101
-
102
-
103
-
104
-
105
-
106
-
107
-
108
-
109
-
110
-
111
-
112
-
113
-
114
-
115
-
116
-
117
-
118
-
119
-
120
-
121
-
122
-
123
-
124
-
125
-
126
-
127
-
128
-
129
-
130
-
131
-
132
-
133
-
134
-
135
-
136
-
137
-
138
-
139
-
140
-
141
-
142
-
143
-
144
-
145
-
146
-
147
-
148
-
149
-
150
-
151
-
152
-
153
-
154
-
155
-
156
 |
 |
behavior. We estimate the volatility of our common stock on the date of grant based on the implied volatility of publicly
traded options on our common stock, with a term of one year or greater. We believe that implied volatility calculated
based on actively traded options on our common stock is a better indicator of expected volatility and future stock price
trends than historical volatility. Therefore, expected volatility for the year ended December 31, 2007 was based on a
market-based implied volatility. The assumptions used in calculating the fair value of stock-based awards represent our
best estimates, but these estimates involve inherent uncertainties and the application of management judgment. As a
result, if factors change and we use different assumptions, our stock-based compensation expense could be materially
different in the future. In addition, we are required to estimate the expected forfeiture rate, as well as the probability that
performance conditions that affect the vesting of certain awards will be achieved, and only recognize expense for those
shares expected to vest. We estimate the forfeiture rate based on historical experience of our stock-based awards that are
granted, exercised, and cancelled. If our actual forfeiture rate is materially different from our estimate, the stock-based
compensation expense could be significantly different from what we have recorded in the current period. See Note 12 —
“Employee Benefits” in the consolidated financial statements for additional information.
Recent Accounting Pronouncements. In September 2006, the Financial Accounting Standards Board (“FASB”) issued
SFAS No. 157, “Fair Value Measurements” (“SFAS 157”), which defines fair value, establishes a framework for
measuring fair value in generally accepted accounting principles, and expands disclosures about fair value measure-
ments. SFAS 157 does not require any new fair value measurements, but provides guidance on how to measure fair value
by providing a fair value hierarchy used to classify the source of the information. SFAS 157 is effective for fiscal years
beginning after November 15, 2007. However, on February 12, 2008, the FASB issued FSP FAS 157-2 which delays the
effective date of SFAS 157 for all nonfinancial assets and nonfinancial liabilities, except those that are recognized or
disclosed at fair value in the financial statements on a recurring basis (at least annually). This FSP partially defers the
effective date of SFAS 157 to fiscal years beginning after November 15, 2008, and interim periods within those fiscal
years for items within the scope of this FSP. Effective for 2008, we will adopt SFAS 157 except as it applies to those
nonfinancial assets and nonfinancial liabilities as noted in FSP FAS 157-2. The partial adoption of SFAS 157 is not
expected to have a material impact on our consolidated financial position, cash flows, or results of operations.
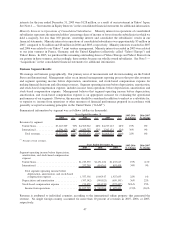
In February 2007, the FASB issued SFAS No. 159, “The Fair Value Option for Financial Assets and Financial
Liabilities” (“SFAS 159”) which permits entities to choose to measure many financial instruments and certain other
items at fair value that are not currently required to be measured at fair value. The provisions of SFAS 159 became
effective for us on January 1, 2008. The adoption of SFAS 159 is not expected to have a material impact on our
consolidated financial position, cash flows, or results of operations.
In December 2007, the FASB issued SFAS No. 141 (revised 2007), “Business Combinations” (“SFAS 141R”) and
SFAS No. 160, “Accounting and Reporting of Noncontrolling Interest in Consolidated Financial Statements, an
amendment of ARB 51” (“SFAS 160”), which will change the accounting for and reporting of business combination
transactions and noncontrolling interests in consolidated financial statements. SFAS 141R and SFAS 160 will be
effective for us on January 1, 2009. We are currently evaluating the impact of adopting SFAS 141R and SFAS 160
on our consolidated financial position, cash flows, and results of operations.
Item 7A. Quantitative and Qualitative Disclosures About Market Risk
We are exposed to the impact of interest rate changes, foreign currency fluctuations, and changes in the market
values of our investments.
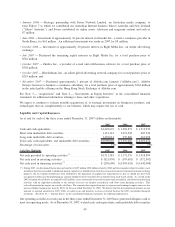
Interest Rate Risk. Our exposure to market rate risk for changes in interest rates relates primarily to our investment
portfolio. We invest excess cash in marketable debt instruments of the United States Government and its agencies,
and in high-quality corporate issuers and, by policy, limit the amount of credit exposure to any one issuer. We
protect and preserve invested funds by limiting default, market, and reinvestment risk.
Investments in both fixed rate and floating rate interest earning instruments carry a degree of interest rate risk. Fixed
rate securities may have their fair market value adversely impacted due to a rise in interest rates, while floating rate
securities may produce less income than expected if interest rates fall. Due in part to these factors, our future
investment income may fall short of expectations due to changes in interest rates or we may suffer losses in principal
if forced to sell securities which have declined in market value due to changes in interest rates. As of December 31,
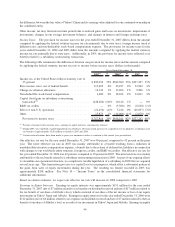
2007 and 2006, we had investments in short-term marketable debt securities of approximately $488 million and
$1,032 million, respectively. Such investments had a weighted-average yield of approximately 4.5 percent and
56