Yahoo 2007 Annual Report Download - page 109
Download and view the complete annual report
Please find page 109 of the 2007 Yahoo annual report below. You can navigate through the pages in the report by either clicking on the pages listed below, or by using the keyword search tool below to find specific information within the annual report.-
 1
1 -
2
-
3
-
4
-
5
-
6
-
7
-
8
-
9
-
10
-
11
-
12
-
13
-
14
-
15
-
16
-
17
-
18
-
19
-
20
-
21
-
22
-
23
-
24
-
25
-
26
-
27
-
28
-
29
-
30
-
31
-
32
-
33
-
34
-
35
-
36
-
37
-
38
-
39
-
40
-
41
-
42
-
43
-
44
-
45
-
46
-
47
-
48
-
49
-
50
-
51
-
52
-
53
-
54
-
55
-
56
-
57
-
58
-
59
-
60
-
61
-
62
-
63
-
64
-
65
-
66
-
67
-
68
-
69
-
70
-
71
-
72
-
73
-
74
-
75
-
76
-
77
-
78
-
79
-
80
-
81
-
82
-
83
-
84
-
85
-
86
-
87
-
88
-
89
-
90
-
91
-
92
-
93
-
94
-
95
-
96
-
97
-
98
-
 99
99 -
 100
100 -
 101
101 -
 102
102 -
 103
103 -
 104
104 -
 105
105 -
 106
106 -
 107
107 -
 108
108 -
 109
109 -
 110
110 -
 111
111 -
 112
112 -
 113
113 -
 114
114 -
 115
115 -
 116
116 -
 117
117 -
 118
118 -
 119
119 -
120
-
121
-
122
-
123
-
124
-
125
-
126
-
127
-
128
-
129
-
130
-
131
-
132
-
133
-
134
-
135
-
136
-
137
-
138
-
139
-
140
-
141
-
142
-
143
-
144
-
145
-
146
-
147
-
148
-
149
-
150
-
151
-
152
-
153
-
154
-
155
-
156
 |
 |

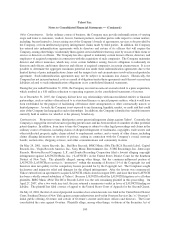
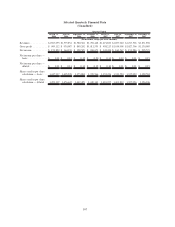
Selected Quarterly Financial Data
(Unaudited)
March 31,
2006
June 30,
2006
September 30,
2006
December 31,
2006
March 31,
2007
June 30,
2007
September 30,
2007
December 31,
2007
Quarters Ended
(In thousands, except per share amounts)
Revenues . . . . . . . . . . . . $1,567,055 $1,575,854 $1,580,322 $1,702,448 $1,671,850 $1,697,920 $1,767,506 $1,831,998
Gross profit . . . . . . . . . . $ 909,112 $ 930,087 $ 899,202 $1,011,555 $ 958,213 $1,014,908 $1,027,306 $1,130,089
Net income . . . . . . . . . . $ 159,859 $ 164,330 $ 158,529 $ 268,673 $ 142,424 $ 160,567 $ 151,286 $ 205,723
Net income per share —
basic . . . . . . . . . . . . . $ 0.11 $ 0.12 $ 0.12 $ 0.20 $ 0.11 $ 0.12 $ 0.11 $ 0.15
Net income per share —
diluted . . . . . . . . . . . . $ 0.11 $ 0.11 $ 0.11 $ 0.19 $ 0.10 $ 0.11 $ 0.11 $ 0.15
Shares used in per share
calculation — basic . . . 1,417,917 1,405,598 1,375,884 1,355,566 1,352,476 1,339,594 1,335,092 1,328,784
Shares used in per share
calculation — diluted . . 1,493,307 1,476,642 1,442,429 1,419,143 1,418,225 1,403,819 1,395,056 1,396,306
107