Yahoo 2007 Annual Report Download - page 47
Download and view the complete annual report
Please find page 47 of the 2007 Yahoo annual report below. You can navigate through the pages in the report by either clicking on the pages listed below, or by using the keyword search tool below to find specific information within the annual report.-
 1
1 -
2
-
3
-
4
-
5
-
6
-
7
-
8
-
9
-
10
-
11
-
12
-
13
-
14
-
15
-
16
-
17
-
18
-
19
-
20
-
21
-
22
-
23
-
24
-
25
-
26
-
27
-
28
-
29
-
30
-
31
-
32
-
33
-
34
-
35
-
36
-
 37
37 -
 38
38 -
 39
39 -
 40
40 -
 41
41 -
 42
42 -
 43
43 -
 44
44 -
 45
45 -
 46
46 -
 47
47 -
 48
48 -
 49
49 -
 50
50 -
 51
51 -
 52
52 -
 53
53 -
 54
54 -
 55
55 -
 56
56 -
 57
57 -
58
-
59
-
60
-
61
-
62
-
63
-
64
-
65
-
66
-
67
-
68
-
69
-
70
-
71
-
72
-
73
-
74
-
75
-
76
-
77
-
78
-
79
-
80
-
81
-
82
-
83
-
84
-
85
-
86
-
87
-
88
-
89
-
90
-
91
-
92
-
93
-
94
-
95
-
96
-
97
-
98
-
99
-
100
-
101
-
102
-
103
-
104
-
105
-
106
-
107
-
108
-
109
-
110
-
111
-
112
-
113
-
114
-
115
-
116
-
117
-
118
-
119
-
120
-
121
-
122
-
123
-
124
-
125
-
126
-
127
-
128
-
129
-
130
-
131
-
132
-
133
-
134
-
135
-
136
-
137
-
138
-
139
-
140
-
141
-
142
-
143
-
144
-
145
-
146
-
147
-
148
-
149
-
150
-
151
-
152
-
153
-
154
-
155
-
156
 |
 |

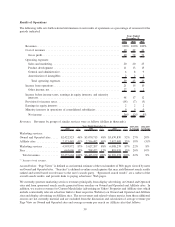
increased $11 million primarily due to our new and expanded facilities. We also incurred costs related to legal
settlements in 2007 of $17 million.
General and administrative expenses for the year ended December 31, 2006 increased $188 million, or 55 percent,
as compared to 2005. The increase was primarily due to an additional $97 million of stock-based compensation
expense as a result of the adoption of SFAS 123R. Additionally, fees for professional services increased $32 million
and facilities expense increased $25 million for the year ended December 31, 2006, compared to the prior year.
General and administrative expenses as a percentage of revenues in 2007 was 9 percent (including 1 percent related
to stock-based compensation expense), compared to 8 percent and 6 percent in 2006 and 2005, respectively.
We currently believe that general and administrative expenses in absolute dollars will increase in 2008 compared to
2007, as we continue to invest in our infrastructure to support our continued business expansion.
Amortization of Intangibles. We have purchased, and expect to continue purchasing, assets and/or businesses,
which may include the purchase of intangible assets. Amortization of developed technology and acquired
intellectual property rights is included in the cost of revenues and not in amortization of intangibles.
Amortization of intangibles was approximately $107 million, or 2 percent of revenues for the year ended
December 31, 2007, compared to $125 million or 2 percent of revenues for 2006 and $109 million or 2 percent
of revenues for 2005. The year over year decrease in amortization of intangibles from 2007 compared to 2006 is due
to declining amortization expenses as a result of intangible assets that became fully amortized during the year
slightly offset by increased amortizable intangible assets from acquisition activity. The increase year over year
from 2006 compared to 2005 in amortization of intangibles reflected our continued acquisition activity resulting in
increased amortizable intangible assets, which were partially offset by declining amortization expenses due to
intangible assets that became fully amortized during the year. As of December 31, 2007, we had net intangible
assets of $611 million on our consolidated balance sheet, including acquired intellectual property rights and
developed technology which are amortized in cost of revenues.
During the years ended December 31, 2007 and December 31, 2006, we acquired $110 million and $6 million,
respectively, of patents and intellectual property rights, included in the “Developed and acquired technology and
intellectual property rights” category of the intangible assets balance as of December 31, 2007 and December 31,
2006, respectively.
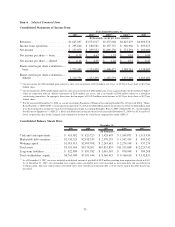
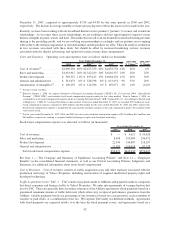
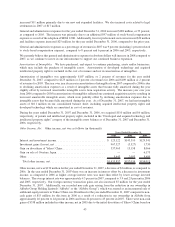
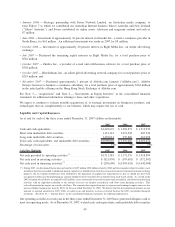
Other Income, Net. Other income, net was as follows (in thousands):
2005 2006 2007
Years Ended December 31,
Interest and investment income ............................... $ 125,122 $143,310 $129,541
Investment gains (losses), net ................................ 967,327 (3,527) 1,730
Gain on divestiture of Yahoo! China ........................... 337,965 15,158 8,066
Gain on sale of Overture Japan............................... — — 6,175
Other .................................................. 5,443 2,093 8,499
Total other income, net . .................................. $1,435,857 $157,034 $154,011
Other income, net was $154 million for the year ended December 31, 2007, a decrease of $3 million, as compared to
2006. In the year ended December 31, 2007 there was an increase in interest offset by a decrease in investment
income, as compared to 2006 as higher average interest rates was more than offset by lower average invested
balances. The average interest rate was approximately 4.3 percent in 2007, compared to 3.9 and 2.9 percent in 2006
and 2005, respectively. Our foreign currency transaction gains, net also increased $7 million for the year ended
December 31, 2007. Additionally, our recorded non-cash gain arising from the reduction in our ownership in
Alibaba Group Holding Limited (“Alibaba” or the “Alibaba Group”), which was treated as an incremental sale of
additional equity interests in Yahoo! China was $8 million for the year ended December 31, 2007 compared to non-
cash gains of $15 million for this item in 2006 as a result of a reduction in our ownership in Alibaba from
approximately 46 percent to 44 percent in 2006 and from 44 percent to 43 percent in 2007. There were non-cash
gains of $338 million included in other income, net in 2005 due to the initial divestiture of Yahoo! China based on
45