Yahoo 2007 Annual Report Download - page 46
Download and view the complete annual report
Please find page 46 of the 2007 Yahoo annual report below. You can navigate through the pages in the report by either clicking on the pages listed below, or by using the keyword search tool below to find specific information within the annual report.-
 1
1 -
2
-
3
-
4
-
5
-
6
-
7
-
8
-
9
-
10
-
11
-
12
-
13
-
14
-
15
-
16
-
17
-
18
-
19
-
20
-
21
-
22
-
23
-
24
-
25
-
26
-
27
-
28
-
29
-
30
-
31
-
32
-
33
-
34
-
35
-
 36
36 -
 37
37 -
 38
38 -
 39
39 -
 40
40 -
 41
41 -
 42
42 -
 43
43 -
 44
44 -
 45
45 -
 46
46 -
 47
47 -
 48
48 -
 49
49 -
 50
50 -
 51
51 -
 52
52 -
 53
53 -
 54
54 -
 55
55 -
 56
56 -
57
-
58
-
59
-
60
-
61
-
62
-
63
-
64
-
65
-
66
-
67
-
68
-
69
-
70
-
71
-
72
-
73
-
74
-
75
-
76
-
77
-
78
-
79
-
80
-
81
-
82
-
83
-
84
-
85
-
86
-
87
-
88
-
89
-
90
-
91
-
92
-
93
-
94
-
95
-
96
-
97
-
98
-
99
-
100
-
101
-
102
-
103
-
104
-
105
-
106
-
107
-
108
-
109
-
110
-
111
-
112
-
113
-
114
-
115
-
116
-
117
-
118
-
119
-
120
-
121
-
122
-
123
-
124
-
125
-
126
-
127
-
128
-
129
-
130
-
131
-
132
-
133
-
134
-
135
-
136
-
137
-
138
-
139
-
140
-
141
-
142
-
143
-
144
-
145
-
146
-
147
-
148
-
149
-
150
-
151
-
152
-
153
-
154
-
155
-
156
 |
 |
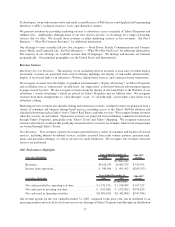
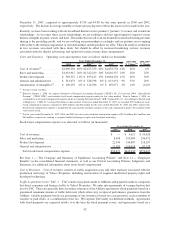
acquisitions. Other sales and marketing expenses increased approximately $30 million primarily due to increased
temporary help and expenses related to new and expanded facilities.
Sales and marketing expenses for the year ended December 31, 2006 increased approximately $288 million, or
28 percent, as compared to 2005. The year over year increase was largely due to increases in compensation expense.
Compensation expense increased approximately $252 million, including an additional $146 million of stock-based
compensation expense, compared to 2005. The increase in stock-based compensation expense was due to our
adoption of SFAS 123R. In addition to stock-based compensation expense, the growth in compensation expense
was also attributable to an increase in our sales and marketing headcount as we expanded our presence in certain
territories to support our growing advertiser base. Additionally, year over year spending on marketing and
distribution increased by $25 million, reflecting our continued investment in our product branding and development
of our distribution channels.
Sales and marketing expenses as a percentage of revenues in 2007 was 23 percent (including 4 percent related to
stock-based compensation expense), compared to 20 percent in both 2006 and 2005, respectively.
We currently believe that sales and marketing expenses will increase in absolute dollars in 2008 compared to 2007,
as we continue to grow and expand our reach to advertisers and users.
Product Development. Product development expenses consist primarily of compensation related expenses
(including stock-based compensation expense) incurred for the development of, enhancements to and maintenance
of Yahoo! Properties, classification and organization of listings within Yahoo! Properties, research and develop-
ment, and Yahoo!’s technology platforms and infrastructure. Depreciation expense and other operating costs are
also included in product development.
Product development expenses for the year ended December 31, 2007 increased $251 million, or 30 percent, as
compared to 2006. Product development compensation expenses increased by approximately $191 million
compared to the prior year, including an additional $73 million of stock-based compensation expense (net of
the $8 million incremental increase to stock-based compensation expense related to the departure of an executive
officer during the second quarter of 2007). The increased compensation expenses reflected our continued hiring of
engineering talent to further develop and enhance new and existing offerings and services on Yahoo! Properties.
Depreciation expense increased $14 million mainly due to our continued investments in information technology
assets and server equipment. Other product and development expenses increased approximately $20 million
primarily due to increased temporary help and expenses related to new and expanded facilities.
Product development expenses for the year ended December 31, 2006 increased approximately $264 million, or
46 percent, as compared to 2005. Product development compensation expense increased by approximately
$248 million compared to 2005, of which $122 million was additional stock-based compensation expense due to
our adoption of SFAS 123R. In addition to stock-based compensation expense, the increased compensation
expenses also reflected our continued hiring of engineering talent to further develop and enhance new and existing
offerings and services on Yahoo! Properties.
Product development expenses as a percentage of revenues in 2007 was 15 percent (including 3 percent related to
stock-based compensation expense), compared to 13 percent and 11 percent in 2006 and 2005, respectively.
We currently believe that product development expenses will increase in absolute dollars in 2008 compared to 2007,
as we believe that continued investments in product development are required to remain competitive.
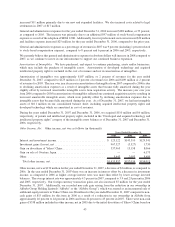
General and Administrative. General and administrative expenses consist primarily of compensation related
expenses (including stock-based compensation expense) related to our legal, finance and human resource orga-
nizations and fees for professional services.
General and administrative expenses for the year ended December 31, 2007 increased $105 million, or 20 percent,
as compared to 2006. Compensation expense increased by $26 million (net of the $16 million reduction in expense
due to the second quarter of 2007 reversal of stock-based compensation expense related to Terry Semel’s
resignation as Chief Executive Officer of the Company) due to an increase in 2007 in our general and administrative
headcount as our infrastructure has grown supporting the underlying growth in our business. Professional services,
including temporary headcount and consulting projects, increased $17 million and our facility related expenses
44