Yahoo 2007 Annual Report Download - page 49
Download and view the complete annual report
Please find page 49 of the 2007 Yahoo annual report below. You can navigate through the pages in the report by either clicking on the pages listed below, or by using the keyword search tool below to find specific information within the annual report.-
 1
1 -
2
-
3
-
4
-
5
-
6
-
7
-
8
-
9
-
10
-
11
-
12
-
13
-
14
-
15
-
16
-
17
-
18
-
19
-
20
-
21
-
22
-
23
-
24
-
25
-
26
-
27
-
28
-
29
-
30
-
31
-
32
-
33
-
34
-
35
-
36
-
37
-
38
-
 39
39 -
 40
40 -
 41
41 -
 42
42 -
 43
43 -
 44
44 -
 45
45 -
 46
46 -
 47
47 -
 48
48 -
 49
49 -
 50
50 -
 51
51 -
 52
52 -
 53
53 -
 54
54 -
 55
55 -
 56
56 -
 57
57 -
 58
58 -
 59
59 -
60
-
61
-
62
-
63
-
64
-
65
-
66
-
67
-
68
-
69
-
70
-
71
-
72
-
73
-
74
-
75
-
76
-
77
-
78
-
79
-
80
-
81
-
82
-
83
-
84
-
85
-
86
-
87
-
88
-
89
-
90
-
91
-
92
-
93
-
94
-
95
-
96
-
97
-
98
-
99
-
100
-
101
-
102
-
103
-
104
-
105
-
106
-
107
-
108
-
109
-
110
-
111
-
112
-
113
-
114
-
115
-
116
-
117
-
118
-
119
-
120
-
121
-
122
-
123
-
124
-
125
-
126
-
127
-
128
-
129
-
130
-
131
-
132
-
133
-
134
-
135
-
136
-
137
-
138
-
139
-
140
-
141
-
142
-
143
-
144
-
145
-
146
-
147
-
148
-
149
-
150
-
151
-
152
-
153
-
154
-
155
-
156
 |
 |

interests for the year ended December 31, 2005 were $128 million, as a result of our investment in Yahoo! Japan.
See Note 4 — “Investments in Equity Interests” in the consolidated financial statements for additional information.
Minority Interests in Operations of Consolidated Subsidiaries. Minority interests in operations of consolidated
subsidiaries represents the minority holders’ percentage share of income or losses from the subsidiaries in which we
hold a majority, but less than 100 percent, ownership interest and consolidate the subsidiaries’ results in our
financial statements. Minority interests in operations of consolidated subsidiaries was approximately $3 million in
2007, compared to $1 million and $8 million in 2006 and 2005, respectively. Minority interests recorded in 2007
and 2006 were related to our Yahoo! 7 joint venture arrangement. Minority interests recorded in 2005 were related
to our joint ventures in France, Germany, and the United Kingdom (collectively called “Yahoo! Europe”) and
Yahoo! Korea. In 2005, we purchased the remaining outstanding shares of Yahoo! Europe and Yahoo! Korea from
our partner in these ventures, and accordingly, these entities became our wholly owned subsidiaries. See Note 3 —
“Acquisitions” in the consolidated financial statements for additional information.
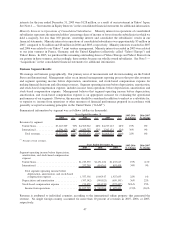
Business Segment Results
We manage our business geographically. Our primary areas of measurement and decision-making are the United
States and International. Management relies on an internal management reporting process that provides revenues
and segment operating income before depreciation, amortization, and stock-based compensation expense for
making financial decisions and allocating resources. Segment operating income before depreciation, amortization,
and stock-based compensation expense, includes income from operations before depreciation, amortization and
stock-based compensation expense. Management believes that segment operating income before depreciation,
amortization, and stock-based compensation expense is an appropriate measure for evaluating the operational
performance of our segments. However, this measure should be considered in addition to and not as a substitute for,
or superior to, income from operations or other measures of financial performance prepared in accordance with
generally accepted accounting principles in the United States (“GAAP”).
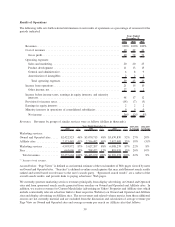
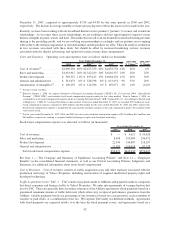
Summarized information by segment was as follows (dollars in thousands):
2005
(*)
2006
(*)
2007
(*)
2005-2006
% Change
2006-2007
% Change
Years Ended December 31,
Revenues by segment:
United States . . . . . . . . . . . $3,667,509 70% $4,365,922 68% $4,727,123 68% 19% 8%
International . . . . . . . . . . . . 1,590,159 30% 2,059,757 32% 2,242,151 32% 30% 9%
Total revenues . . . . . . . . . $5,257,668 100% $6,425,679 100% $6,969,274 100% 22% 8%
(*)
Percent of total revenues.
2005 2006 2007
2005-2006
% Change
2006-2007
% Change
Years Ended December 31,
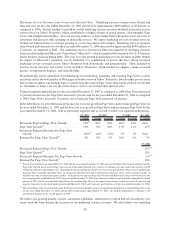
Segment operating income before depreciation,
amortization, and stock-based compensation
expense:
United States . . . . . . . . . . . . . . . . . . . . . . . . . . . $1,219,539 $1,451,656 $1,433,617 19% (1)%
International . . . . . . . . . . . . . . . . . . . . . . . . . . . 337,799 454,261 493,418 34% 9%
Total segment operating income before
depreciation, amortization, and stock-based
compensation expense . . . . . . . . . . . . . . . . . 1,557,338 1,905,917 1,927,035 22% 1%
Depreciation and amortization . . . . . . . . . . . . . . . (397,142) (540,021) (659,195) 36% 22%
Stock-based compensation expense . . . . . . . . . . . (52,471) (424,930) (572,427) N/A% 35%
Income from operations. . . . . . . . . . . . . . . . . . $1,107,725 $ 940,966 $ 695,413 (15)% (26)%
Revenue is attributed to individual countries according to the international online property that generated the
revenue. No single foreign country accounted for more than 10 percent of revenues in 2007, 2006, or 2005,
respectively.
47