Yahoo 2007 Annual Report Download - page 50
Download and view the complete annual report
Please find page 50 of the 2007 Yahoo annual report below. You can navigate through the pages in the report by either clicking on the pages listed below, or by using the keyword search tool below to find specific information within the annual report.-
 1
1 -
2
-
3
-
4
-
5
-
6
-
7
-
8
-
9
-
10
-
11
-
12
-
13
-
14
-
15
-
16
-
17
-
18
-
19
-
20
-
21
-
22
-
23
-
24
-
25
-
26
-
27
-
28
-
29
-
30
-
31
-
32
-
33
-
34
-
35
-
36
-
37
-
38
-
39
-
 40
40 -
 41
41 -
 42
42 -
 43
43 -
 44
44 -
 45
45 -
 46
46 -
 47
47 -
 48
48 -
 49
49 -
 50
50 -
 51
51 -
 52
52 -
 53
53 -
 54
54 -
 55
55 -
 56
56 -
 57
57 -
 58
58 -
 59
59 -
 60
60 -
61
-
62
-
63
-
64
-
65
-
66
-
67
-
68
-
69
-
70
-
71
-
72
-
73
-
74
-
75
-
76
-
77
-
78
-
79
-
80
-
81
-
82
-
83
-
84
-
85
-
86
-
87
-
88
-
89
-
90
-
91
-
92
-
93
-
94
-
95
-
96
-
97
-
98
-
99
-
100
-
101
-
102
-
103
-
104
-
105
-
106
-
107
-
108
-
109
-
110
-
111
-
112
-
113
-
114
-
115
-
116
-
117
-
118
-
119
-
120
-
121
-
122
-
123
-
124
-
125
-
126
-
127
-
128
-
129
-
130
-
131
-
132
-
133
-
134
-
135
-
136
-
137
-
138
-
139
-
140
-
141
-
142
-
143
-
144
-
145
-
146
-
147
-
148
-
149
-
150
-
151
-
152
-
153
-
154
-
155
-
156
 |
 |
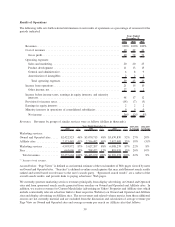
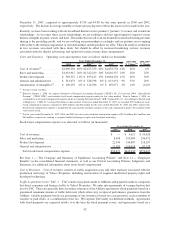
United States. United States revenues for the year ended December 31, 2007 increased approximately $361 mil-
lion, or 8 percent, as compared to 2006. United States revenues for the year ended December 31, 2006 increased
approximately $698 million, or 19 percent, as compared to 2005. The year over year increases in 2007 and 2006
were a result of growth in advertising across Yahoo! Properties, as well as growth from our fee-based services.
Approximately 79 percent of the 2007 increase, or $286 million, came from marketing services revenues.
Approximately 82 percent of the 2006 increase, or $570 million, came from marketing services revenues and
approximately 82 percent of the 2005 increase, or $827 million, came from marketing services revenues. The
advertising growth can be attributed to our expanding user base which has been attracting more advertisers and has
been contributing to our growth in our advertising revenues. The growth in our fee-based services is due to the
increase in our paying users for both existing and new offerings. United States operating income before
depreciation, amortization, and stock-based compensation expense for the year ended December 31, 2007
decreased $18 million, or 1 percent, as compared to 2006. United States operating income before depreciation,
amortization, and stock-based compensation expense for the year ended December 31, 2006 increased $232 million,
or 19 percent, as compared to 2005.
International. International revenues for the year ended December 31, 2007 increased approximately $182 mil-
lion, or 9 percent, as compared to 2006. International revenues for the year ended December 31, 2006 increased
approximately $470 million, or 30 percent, as compared to 2005. More than 95 percent of the international revenues
increase in 2007 and 2006 came from marketing services revenues. The year over year growth in international
marketing services revenues can be attributed to our increased penetration into existing markets, coupled with
continued growth of the global online advertising marketplace. International operating income before depreciation,
amortization, and stock-based compensation expense for the year ended December 31, 2007 increased $39 million,
or 9 percent, as compared to 2006. International operating income before depreciation, amortization, and stock-
based compensation expense for the year ended December 31, 2006 increased $116 million, or 34 percent, as
compared to 2005.
International revenues accounted for approximately 32 percent of total revenues during both 2007 and 2006 and
30 percent during 2005. The strong performance of our international operations has increased our exposure to
foreign currency fluctuations. Revenues and related expenses generated from our international subsidiaries are
generally denominated in the currencies of the local countries. Primary currencies include Euros, British Pounds,
Japanese Yen, Korean Won, Taiwan Dollars, Australian Dollars, and Canadian Dollars. The statements of income
of our international operations are translated into United States dollars at the average exchange rates in each
applicable period. To the extent the United States dollar strengthens against foreign currencies, the translation of
these foreign currency denominated transactions results in reduced revenues, operating expenses, and net income
for our International segment. Similarly, our revenues, operating expenses, and net income will increase for our
International segment if the United States dollar weakens against foreign currencies. Using the average foreign
currency exchange rates in the year ended December 31, 2006, our international revenues for 2007 would have been
lower than we reported by approximately $87 million and our international segment operating income before
depreciation, amortization, and stock-based compensation expense would have been lower than we reported by
$16 million.
Transactions
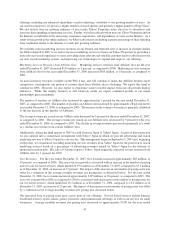
Significant acquisitions and strategic investments completed in the last three years include the following:
•February 2005 — Verdisoft, a software development company for a purchase price of $58 million and issuance of
restricted stock valued at $35 million;
•October 2005 — Strategic investment of approximately 46 percent (40 percent on a fully diluted basis) in the
outstanding common stock of Alibaba, an e-commerce company based in China in exchange for $1.0 billion in
cash and the contribution of Yahoo! China;
•November 2005 — Purchase of the remaining outstanding shares of Yahoo! Europe and Yahoo! Korea for a total
purchase price of $501 million;
48