APC 2009 Annual Report Download - page 10
Download and view the complete annual report
Please find page 10 of the 2009 APC annual report below. You can navigate through the pages in the report by either clicking on the pages listed below, or by using the keyword search tool below to find specific information within the annual report.-
 1
1 -
 2
2 -
 3
3 -
 4
4 -
 5
5 -
 6
6 -
 7
7 -
 8
8 -
 9
9 -
 10
10 -
 11
11 -
 12
12 -
 13
13 -
 14
14 -
 15
15 -
 16
16 -
 17
17 -
 18
18 -
 19
19 -
 20
20 -
 21
21 -
22
-
23
-
24
-
25
-
26
-
27
-
28
-
29
-
30
-
31
-
32
-
33
-
34
-
35
-
36
-
37
-
38
-
39
-
40
-
41
-
42
-
43
-
44
-
45
-
46
-
47
-
48
-
49
-
50
-
51
-
52
-
53
-
54
-
55
-
56
-
57
-
58
-
59
-
60
-
61
-
62
-
63
-
64
-
65
-
66
-
67
-
68
-
69
-
70
-
71
-
72
-
73
-
74
-
75
-
76
-
77
-
78
-
79
-
80
-
81
-
82
-
83
-
84
-
85
-
86
-
87
-
88
-
89
-
90
-
91
-
92
-
93
-
94
-
95
-
96
-
97
-
98
-
99
-
100
-
101
-
102
-
103
-
104
-
105
-
106
-
107
-
108
-
109
-
110
-
111
-
112
-
113
-
114
-
115
-
116
-
117
-
118
-
119
-
120
-
121
-
122
-
123
-
124
-
125
-
126
-
127
-
128
-
129
-
130
-
131
-
132
-
133
-
134
-
135
-
136
-
137
-
138
-
139
-
140
-
141
-
142
-
143
-
144
-
145
-
146
-
147
-
148
-
149
-
150
-
151
-
152
-
153
-
154
-
155
-
156
-
157
-
158
-
159
-
160
-
161
-
162
-
163
-
164
-
165
-
166
-
167
-
168
-
169
-
170
-
171
-
172
-
173
-
174
-
175
-
176
-
177
-
178
-
179
-
180
-
181
-
182
-
183
-
184
-
185
-
186
-
187
-
188
-
189
-
190
-
191
-
192
-
193
-
194
-
195
-
196
-
197
-
198
-
199
-
200
-
201
-
202
-
203
-
204
-
205
-
206
-
207
-
208
-
209
-
210
-
211
-
212
-
213
-
214
-
215
-
216
-
217
-
218
-
219
-
220
-
221
-
222
-
223
-
224
-
225
-
226
-
227
-
228
-
229
-
230
-
231
-
232
-
233
-
234
-
235
-
236
-
237
-
238
-
239
-
240
-
241
-
242
-
243
-
244
 |
 |

2009 REGISTRATION DOCUMENT SCHNEIDER ELECTRIC8
KEY FIGURES 2009
>
Key figures 2009
SCHNEIDER ELECTRIC
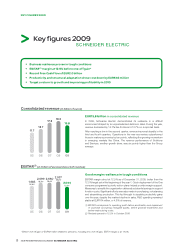
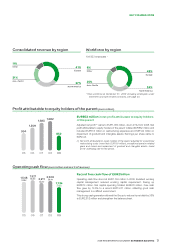
Consolidated revenue (in billion of euros )
EUR 15,8 billion in consolidated revenue
In 2009, Schneider Electric demonstrated its resilience in a diffi cult
environment shaped by an unprecedented decline in sales. During the year,
revenue decreased by 15.7% like-for-like and 13.7% on a reported basis.
After reaching a low in the second quarter, revenue improved steadily in the
third and fourth quarters. Operations in the new economies outperformed
those in mature economies by ten points, refl ecting the growing momentum
in emerging markets like China. The revenue performance of Solutions
and Services, another growth driver, was six points higher than the Group
average.
EBITAR(1) (in million of euros and as a % of revenue)
Good margin resilience in tough conditions
EBITAR margin stood at 12.9% as of December 31, 2009, better than the
12.0% target set at the beginning of the year (2 ). Quick deployment of the One
company programme ’s priority action plans helped provide margin support.
Measures to simplify the organisation delivered substantial savings in support
function costs. Signifi cant efforts were also made in purchasing, re-balancing
and streamlining production. This fed through to sizeable productivity gains
over the year, despite the marked decline in sales. R&D spending remained
stable at EUR 764 million, or 4.8% of revenue.
(1) EBITAR corresponds to operating profit before amortisation and impairment
of purchase accounting intangible assets, before goodwill impairment and
before restructuring costs.
(2 ) Revised upward to 12.5% in October 2009.
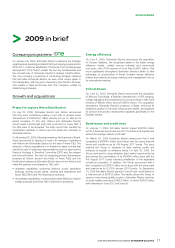
•Business resilience proven in t ough conditions
•EBITAR(1) margin at 12.9% before one-off gain*
•Record Free Cash Flow of EUR 2.0billion
•Productivity and structural adaptation drove cost down by EUR 646million
•Target a return to growth and improving profitability in 2010
* Before one-off gain of EUR 92million related to pensions. Including this one-off gain, EBITA margin is at 13.5%.
05
11.7
09
15.8
06
13.7
07
17.3
08
18.3
05 0906 07 08
1,685
14.4%
2,099
15.3%
2,660
15.4%
2,937
16.0%
2,044
12.9% *