APC 2009 Annual Report Download - page 74
Download and view the complete annual report
Please find page 74 of the 2009 APC annual report below. You can navigate through the pages in the report by either clicking on the pages listed below, or by using the keyword search tool below to find specific information within the annual report.-
 1
1 -
2
-
3
-
4
-
5
-
6
-
7
-
8
-
9
-
10
-
11
-
12
-
13
-
14
-
15
-
16
-
17
-
18
-
19
-
20
-
21
-
22
-
23
-
24
-
25
-
26
-
27
-
28
-
29
-
30
-
31
-
32
-
33
-
34
-
35
-
36
-
37
-
38
-
39
-
40
-
41
-
42
-
43
-
44
-
45
-
46
-
47
-
48
-
49
-
50
-
51
-
52
-
53
-
54
-
55
-
56
-
57
-
58
-
59
-
60
-
61
-
62
-
63
-
 64
64 -
 65
65 -
 66
66 -
 67
67 -
 68
68 -
 69
69 -
 70
70 -
 71
71 -
 72
72 -
 73
73 -
 74
74 -
 75
75 -
 76
76 -
 77
77 -
 78
78 -
 79
79 -
 80
80 -
 81
81 -
 82
82 -
 83
83 -
 84
84 -
85
-
86
-
87
-
88
-
89
-
90
-
91
-
92
-
93
-
94
-
95
-
96
-
97
-
98
-
99
-
100
-
101
-
102
-
103
-
104
-
105
-
106
-
107
-
108
-
109
-
110
-
111
-
112
-
113
-
114
-
115
-
116
-
117
-
118
-
119
-
120
-
121
-
122
-
123
-
124
-
125
-
126
-
127
-
128
-
129
-
130
-
131
-
132
-
133
-
134
-
135
-
136
-
137
-
138
-
139
-
140
-
141
-
142
-
143
-
144
-
145
-
146
-
147
-
148
-
149
-
150
-
151
-
152
-
153
-
154
-
155
-
156
-
157
-
158
-
159
-
160
-
161
-
162
-
163
-
164
-
165
-
166
-
167
-
168
-
169
-
170
-
171
-
172
-
173
-
174
-
175
-
176
-
177
-
178
-
179
-
180
-
181
-
182
-
183
-
184
-
185
-
186
-
187
-
188
-
189
-
190
-
191
-
192
-
193
-
194
-
195
-
196
-
197
-
198
-
199
-
200
-
201
-
202
-
203
-
204
-
205
-
206
-
207
-
208
-
209
-
210
-
211
-
212
-
213
-
214
-
215
-
216
-
217
-
218
-
219
-
220
-
221
-
222
-
223
-
224
-
225
-
226
-
227
-
228
-
229
-
230
-
231
-
232
-
233
-
234
-
235
-
236
-
237
-
238
-
239
-
240
-
241
-
242
-
243
-
244
 |
 |

2009 REGISTRATION DOCUMENT SCHNEIDER ELECTRIC72
SUSTAINABLE DEVELOPMENT
2METHODOLOGY
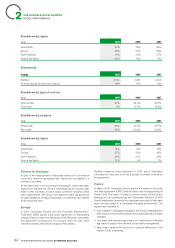
Definitions
Planet & Society Barometer
CO2 emissions
In 2009, this indicator included SF6 gas leakage at the nine sites
concerned by this substance, energy consumption at reporting sites
and long-distance airfreight originating in France. CO2 equivalent
emissions for 2009 were compared with data for 2008 at comparable
Group structure but at 2009 business levels. The indicator calculates
the change in performance.
Green Premium lineup
For Green Premium products, a Product Environmental Profi le (PEP),
a guide for end-of-life disassembly and disposal and a list of any
substances governed by the European REACH directive are provided
online. In addition, Green Premium products comply with thresholds
defi ned in the European RoHS directive.
Global Compact
This indicator tracks the percentage of unit purchases made from
Global Compact signatories in 2009 or equivalent. As concerns
electronics equipment suppliers, the Electronic Industry code of
conduct (EICC) is used as an equivalent for the Global Compact
in the indicator.
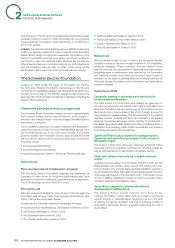
Employee Net Promoter Score
In 2009, Schneider Electric surveyed all of its employees using
the Net Promoter Score method. The result shows the difference
between the percentage of Promoters and Detractors.
Train 10,000 young people from the base of the
pyramid in electricity
This indicator counts the number of students enrolled in training
courses supported by Schneider Electric for people at the base of
the pyramid.
Human resources, safety and environmental
data
F requency rate
The lost time injury frequency rate corresponds to the number of
accidents resulting in more than one day of lost work over a period
of twelve months per millions hours worked.
Severy Rate
The severy Rate is the number of days compensated per 1,000hours
worked, i.e. the number of days lost by temporary incapacity for
1,000hours worked .
CO2
The Group uses the method endorsed by the International Energy
Agency in 2000 to convert energy consumption into CO2 equivalent.
The conversion factors may be global (natural gas, fuel oil, diesel) or
national (electricity, urban heating, etc.).
Waste
The fi gures do not include exceptional waste, such as that from
building demolition or household waste.
Volatile organic compounds (VOCs)
Given the nature of the Group’s business, an estimate was made of
VOC emissions in 2009 to provide a rough approximation.
Product Environmental Profiles (PEPs)
This indicator corresponds to the number of PEPs compiled by
Schneider Electric.