APC 2009 Annual Report Download - page 110
Download and view the complete annual report
Please find page 110 of the 2009 APC annual report below. You can navigate through the pages in the report by either clicking on the pages listed below, or by using the keyword search tool below to find specific information within the annual report.-
 1
1 -
2
-
3
-
4
-
5
-
6
-
7
-
8
-
9
-
10
-
11
-
12
-
13
-
14
-
15
-
16
-
17
-
18
-
19
-
20
-
21
-
22
-
23
-
24
-
25
-
26
-
27
-
28
-
29
-
30
-
31
-
32
-
33
-
34
-
35
-
36
-
37
-
38
-
39
-
40
-
41
-
42
-
43
-
44
-
45
-
46
-
47
-
48
-
49
-
50
-
51
-
52
-
53
-
54
-
55
-
56
-
57
-
58
-
59
-
60
-
61
-
62
-
63
-
64
-
65
-
66
-
67
-
68
-
69
-
70
-
71
-
72
-
73
-
74
-
75
-
76
-
77
-
78
-
79
-
80
-
81
-
82
-
83
-
84
-
85
-
86
-
87
-
88
-
89
-
90
-
91
-
92
-
93
-
94
-
95
-
96
-
97
-
98
-
99
-
 100
100 -
 101
101 -
 102
102 -
 103
103 -
 104
104 -
 105
105 -
 106
106 -
 107
107 -
 108
108 -
 109
109 -
 110
110 -
 111
111 -
 112
112 -
 113
113 -
 114
114 -
 115
115 -
 116
116 -
 117
117 -
 118
118 -
 119
119 -
 120
120 -
121
-
122
-
123
-
124
-
125
-
126
-
127
-
128
-
129
-
130
-
131
-
132
-
133
-
134
-
135
-
136
-
137
-
138
-
139
-
140
-
141
-
142
-
143
-
144
-
145
-
146
-
147
-
148
-
149
-
150
-
151
-
152
-
153
-
154
-
155
-
156
-
157
-
158
-
159
-
160
-
161
-
162
-
163
-
164
-
165
-
166
-
167
-
168
-
169
-
170
-
171
-
172
-
173
-
174
-
175
-
176
-
177
-
178
-
179
-
180
-
181
-
182
-
183
-
184
-
185
-
186
-
187
-
188
-
189
-
190
-
191
-
192
-
193
-
194
-
195
-
196
-
197
-
198
-
199
-
200
-
201
-
202
-
203
-
204
-
205
-
206
-
207
-
208
-
209
-
210
-
211
-
212
-
213
-
214
-
215
-
216
-
217
-
218
-
219
-
220
-
221
-
222
-
223
-
224
-
225
-
226
-
227
-
228
-
229
-
230
-
231
-
232
-
233
-
234
-
235
-
236
-
237
-
238
-
239
-
240
-
241
-
242
-
243
-
244
 |
 |

2009 REGISTRATION DOCUMENT SCHNEIDER ELECTRIC108
BUSINESS REVIEW
4REVIEW OF THE CONSOLIDATED FINANCIAL STATEMENTS
Breakdown by region
Revenue from Europe declined 20.7% to EUR 6,423million on a
reported basis. On a constant structure and currency basis, the
decrease came to 18.5%. Operations in France showed the greatest
resilience, while countries with a heavy focus on the industry market,
such as Germany and Italy, were harder hit. Spain also suffered
due to low demand in construction. Revenue from Eastern Europe
refl ected weak industrial demand and the dearth of fi nancing for
building projects, despite a more resilient infrastructure market.
In North America, revenue totalled EUR 4,356million, a decrease of
13.8% including negative organic growth of 19.9%. Demand was
particularly anaemic in the industrial and building markets, but held
fi rmer in the data centre market, thanks notably to an upturn in the
last quarter.
Revenue from the Asia-Pacifi c region totalled EUR 3,278million,
down 3.4% on a current basis and 9.7% on a constant structure
and currency basis. Full-year revenue from China edged up slightly
thanks to a strong recovery in the second half of the year, while
revenue from India declined less than the regional average. The other
countries, however, showed double-digit decreases, with particularly
large declines in the industry and data centre markets.
Revenue from the Rest of the World edged back 1.5% on a
current basis, to EUR 1,736million, and 2.4% on a constant basis.
Operations in Africa again recorded growth, thanks to energy and
infrastructure projects, whereas business contracted in the Middle
East and South America, in tandem with the overall economy.
Breakdown by business
Electrical Distribution generated revenue of EUR 9,175 million, or 58%
of the consolidated total. This represents a decrease of 11.3% on a
current basis and 13.4% like-for-like.
Automation & Control revenue fell 20.0% on a reported basis to
EUR 4,252 million. Like-for-like, the decline came to 21.3 %.
Revenue from Critical Power and Cooling Services totalled
EUR 2,366million, down 10.9% on a current basis and 13.6% on
a constant basis.
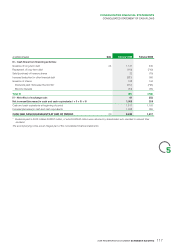
Operating profit and EBITAR
Presentation of the interest component of defined
benefit pension plan costs
Through 2008, all costs related to defi ned benefi t pension plans,
termination benefi ts and other post-retirement benefi t obligations
were recognised in operating profi t (EBITA). To provide a more
meaningful picture of operating profit by excluding all financial
income and expense, the Group decided to present the interest
component of these costs and the expected return on plan assets
in “Finance costs and other fi nancial income and expense, net” as
from January 1, 2009. As a result of this change, EUR 19million
recorded under operating profi t in 2008 has been reclassifi ed under
other “Finance costs and fi nancial income and expense, net”. The
comparative fi nancial statements refl ect this impact and are the basis
of the discussion below.
EBITAR declined a reported 27.3% to EUR 2,136million from
EUR 2,937million in 2008. In 2009, EBITAR included an exceptional
EUR 92million pension curtailment gain in the United States. Restated
for this gain, EBITAR margin came to 12.9% versus 16.0 % in 2008.
The negative impacts of the volume effect (EUR 1,305million),
geographic and product mix (EUR 244million) and currency effect
(EUR 88million) were partially offset by positive impacts from pricing
(EUR 152million), productivity (EUR 105million), production cost
savings (EUR 94million, stemming in part from a slight decrease
in raw material costs net of hedging) and a signifi cant reduction in
support function costs (EUR 541million excluding EUR 80million in
salary infl ation and global information system deployment costs).
In 2009, capitalisation of development costs had a positive net
impact on operating profit of EUR 126million, on a par with
EUR 133million in 2008.
EBITAR margin by region
The ratio of EBITAR to revenue does not include general
management and global function expenses that cannot be allocated
to a particular segment. Europe reported an EBITAR margin of 15.1%
in 2009, down 4.0 points from the previous year. North America
reported an EBITAR margin of 15.1% that includes the exceptional
EUR 92 pension curtailment gain in the United States. Excluding this
non-recurring item, EBITAR margin came to 12.9%, down 4.0 points
from December31, 2008. EBITAR margin in the Asia-Pacifi c region
narrowed by 0.3 points to end the year at 16.0%. EBITAR margin in
the Rest of the World edged back by 0.2 points to 16.4%.
EBITAR margin by business
The Electrical Distribution business reported an EBITAR margin of
17.8%. Excluding the exceptional pension curtailment gain, EBITAR
margin declined by 2.8 points to 17.0%. The Automation & Control
business reported an EBITAR margin of 10.0%. Excluding the
exceptional pension curtailment gain, EBITAR margin contracted
by 5.8 points to 9.6%. Lastly, in Critical Power and Cooling Services,
EBITAR margin widened by one point to 15.8%.
Other operating expenses
Restructuring expenses
Non-recurring restructuring expenses totalled EUR 313million and
mainly concerned measures taken in response to the economic and
fi nancial crisis. These expenses were primarily recorded in Europe
(EUR 240million) and North America (EUR 55million).
Impairment of goodwill
In 2009, operating profi t (EBIT) included a EUR 231million charge
for amortisation and impairment of purchase accounting intangibles,
compared with EUR 174million in the year-earlier period. The
increase primarily refl ects a EUR 118million charge for the CST CGU
(including its SDA business, which is currently being discontinued),
compared with EUR 70million in 2008.
Finance costs and other financial income and
expense, net
Finance costs and other financial income and expense, net
represented a net expense of EUR 384million compared with a
EUR 333million net expense in 2008. Net fi nance costs rose by
EUR 51million from the previous year to EUR 297million. The increase
refl ects two factors: (i) in 2008, the Group recorded non-recurring
interest income of EUR 25million corresponding to interest on a tax
receivable and, (ii) interest income on cash and cash equivalents
declined to EUR 26million in 2009 from EUR 48million in 2008.
Changes in exchange rates after hedging, which added
EUR 87million to fi nancial expense in 2008, had virtually no impact in
2009. The 2008 fi gure refl ected the exceptional volatility of exchange
rates in the last months of the year and the reimbursement of long-