APC 2009 Annual Report Download - page 57
Download and view the complete annual report
Please find page 57 of the 2009 APC annual report below. You can navigate through the pages in the report by either clicking on the pages listed below, or by using the keyword search tool below to find specific information within the annual report.-
 1
1 -
2
-
3
-
4
-
5
-
6
-
7
-
8
-
9
-
10
-
11
-
12
-
13
-
14
-
15
-
16
-
17
-
18
-
19
-
20
-
21
-
22
-
23
-
24
-
25
-
26
-
27
-
28
-
29
-
30
-
31
-
32
-
33
-
34
-
35
-
36
-
37
-
38
-
39
-
40
-
41
-
42
-
43
-
44
-
45
-
46
-
 47
47 -
 48
48 -
 49
49 -
 50
50 -
 51
51 -
 52
52 -
 53
53 -
 54
54 -
 55
55 -
 56
56 -
 57
57 -
 58
58 -
 59
59 -
 60
60 -
 61
61 -
 62
62 -
 63
63 -
 64
64 -
 65
65 -
 66
66 -
 67
67 -
68
-
69
-
70
-
71
-
72
-
73
-
74
-
75
-
76
-
77
-
78
-
79
-
80
-
81
-
82
-
83
-
84
-
85
-
86
-
87
-
88
-
89
-
90
-
91
-
92
-
93
-
94
-
95
-
96
-
97
-
98
-
99
-
100
-
101
-
102
-
103
-
104
-
105
-
106
-
107
-
108
-
109
-
110
-
111
-
112
-
113
-
114
-
115
-
116
-
117
-
118
-
119
-
120
-
121
-
122
-
123
-
124
-
125
-
126
-
127
-
128
-
129
-
130
-
131
-
132
-
133
-
134
-
135
-
136
-
137
-
138
-
139
-
140
-
141
-
142
-
143
-
144
-
145
-
146
-
147
-
148
-
149
-
150
-
151
-
152
-
153
-
154
-
155
-
156
-
157
-
158
-
159
-
160
-
161
-
162
-
163
-
164
-
165
-
166
-
167
-
168
-
169
-
170
-
171
-
172
-
173
-
174
-
175
-
176
-
177
-
178
-
179
-
180
-
181
-
182
-
183
-
184
-
185
-
186
-
187
-
188
-
189
-
190
-
191
-
192
-
193
-
194
-
195
-
196
-
197
-
198
-
199
-
200
-
201
-
202
-
203
-
204
-
205
-
206
-
207
-
208
-
209
-
210
-
211
-
212
-
213
-
214
-
215
-
216
-
217
-
218
-
219
-
220
-
221
-
222
-
223
-
224
-
225
-
226
-
227
-
228
-
229
-
230
-
231
-
232
-
233
-
234
-
235
-
236
-
237
-
238
-
239
-
240
-
241
-
242
-
243
-
244
 |
 |

SUSTAINABLE DEVELOPMENT
2009 REGISTRATION DOCUMENT SCHNEIDER ELECTRIC 55
2
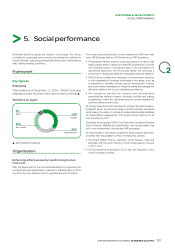
SOCIAL PERFORMANCE
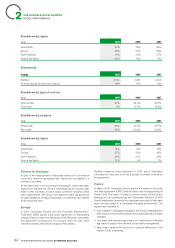
Zoom 2009 – Health and safety conditions
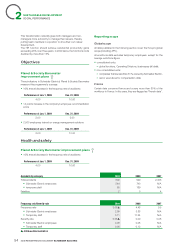
Health and safety
During the summer of 2009, Schneider Electric updated its global Health
and Safety policy, which emphasizes the key aspects of the Group’s
approach: preventing accidents and risk situations, ensuring continuous
improvement, sharing good practices, involving all stakeholders and
creating the conditions for physical, mental and social well-being. This
policy is aligned with the Word Health Organisation ’s defi nition of health
and Schneider Electric’s internal Principles of Responsibility.
In 2009, the number of days lost due to work accidents declined by 32 %
from 2008, compared with an improvement target of 10%. Coming on
the heels of a 5 3% drop in 2008, this sharp decline refl ects the priority
focus on safety at all Schneider Electric units.
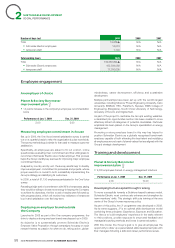
Efforts in 2008 concentrated on securing management commitment,
creating leadership and coordination resources and getting employees
actively involved in improving safety results. Building on these
achievements, the Group turned its focus in 2009 to evaluating risks,
training, internal audits and continued deployment in the units of a
safety management system based on ILO-OSH guidelines or OHSAS
18001. On November4, 2009, Schneider Electric presented its progress
in deploying safety management systems at the ILO’s international
conference in Düsseldorf, Germany.
Starting in June 2009, all Group units took steps to prepare for the H1N1
swine fl u pandemic with a business continuity/fl u pandemic plan. A
Schneider Electric Emergency Coordination Centre (SECC) was set up
to facilitate management of local situations, notably concerning health
measures.
Significant measures concerning training, risk evaluation
and internal audits
• Specifi c training sessions were organised for the Group’s Chinese
and Indian managers.
• Specifi c training was also provided on preventing electrical risks in
China and India. This topic will be a key focus in 2010 with all services
team members who visit customer sites regularly, notably in the areas
of low voltage power and medium voltage.
• Safety audits were conducted in China, India and Indonesia.
• Intranet-based training modules on evaluating risks and preventing
work accidents have been made accessible to all.
Measures to continuously enhance resources
• Safety libraries have been made available to managers and members
of the Company’s safety network.
• In 2009, the Group continued to deploy a work safety management
system (SMS) based on ILO-OSH guidelines and OHSAS 18001 in
all the manufacturing and supply chain units. By the end of the year,
some 83 % of the units had implemented an SMS at their sites. The
goal is to raise this level to 100% before end 2010. SMSs guarantee
compliance with legislation and help improve the Group’s health
performance by identifying hazardous situations and evaluating risks.
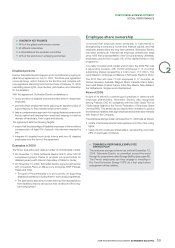
Examples in 2009
• India – Involving managers to get as close to zero accidents
as possible. The Catalyst project, which covers three different
plants, focuses on involving managers as health ambassadors. It
also motivates by selecting an employee of the month. A Safety
Champion supervises and monitors all work safety committees and
projects, including measures to analyse the causes of accidents and
safety training.
Managers, who play a key role in plant safety, serve as change
catalysts. The number of days lost due to work accidents was halved
in 2009 and the average number of hours of safety training per person
was doubled in relation to 2008.
• United Kingdom – Eliminating accident risks at the source. The
Swindon plant, the fi rst OHSAS 18001 site in England, has set up a
system to identify all risks—including minor ones—and all situations
that could involve risk for operators. The data have been entered in
a single base used to analyse and eliminate risk situations through
corrective action.
Thanks to this effi cient prevention approach, the number of days lost
due to work accidents declined from 26 in 2008 to zero in 2009, for
a 100% improvement in the frequency rate.
• Argentina – Preventing H1N1 swine flu. In accordance with the
recommendations issued by the Schneider Electric Emergency
Coordination Centre , all of the Group’s teams in Argentina took
steps to keep the fl u from spreading. A country project team oversaw
communication and recommendations to wash hands, installing gel
sanitizers and distributing cleaning equipment. No cases of swine fl u
have been reported to date.
• Italy – Taking action to prevent accidents. Following on from an
initial project launched in 2008 that signifi cantly reduced the number
of work accidents, the manufacturing team in Italy set up a system
to track micro-accidents in 2009 using an analysis and processing
method inspired by the Six Sigma quality methodology applied in the
Company for many years.
The action plan primarily involved training operators and managers,
working with suppliers to reduce package weight, analysing
workstation ergonomics, deploying an ILO-OSH-compliant safety
management system and optimising factory fl oor organisation .
In 2009, the number of days lost due to work accidents was divided
by fi ve.
• New Zealand – Motivating employees to significantly reduce
accidents. After extensive training in the front lines and a detailed
analysis of accidents recorded over the last few years, the Group’s
team in New Zealand distributed forms to employees asking them
to report everyday situations they consider dangerous, as well as
any near-accidents.
The data collected in monthly reviews gave management the
necessary feedback to make effective decisions on how to manage,
support and schedule improvement plans. The country organisation ’s
Safety Management System facilitated the process greatly.
In 2009, the number of days lost due to work accidents was divided
by fi ve and the number of cuts on hands (the main cause of accidents)
declined by 93%.
All of these good practices have been posted on the Company’s
intranet and are accessible to all Schneider Electric managers and
employees.