APC 2009 Annual Report Download - page 48
Download and view the complete annual report
Please find page 48 of the 2009 APC annual report below. You can navigate through the pages in the report by either clicking on the pages listed below, or by using the keyword search tool below to find specific information within the annual report.-
 1
1 -
2
-
3
-
4
-
5
-
6
-
7
-
8
-
9
-
10
-
11
-
12
-
13
-
14
-
15
-
16
-
17
-
18
-
19
-
20
-
21
-
22
-
23
-
24
-
25
-
26
-
27
-
28
-
29
-
30
-
31
-
32
-
33
-
34
-
35
-
36
-
37
-
 38
38 -
 39
39 -
 40
40 -
 41
41 -
 42
42 -
 43
43 -
 44
44 -
 45
45 -
 46
46 -
 47
47 -
 48
48 -
 49
49 -
 50
50 -
 51
51 -
 52
52 -
 53
53 -
 54
54 -
 55
55 -
 56
56 -
 57
57 -
 58
58 -
59
-
60
-
61
-
62
-
63
-
64
-
65
-
66
-
67
-
68
-
69
-
70
-
71
-
72
-
73
-
74
-
75
-
76
-
77
-
78
-
79
-
80
-
81
-
82
-
83
-
84
-
85
-
86
-
87
-
88
-
89
-
90
-
91
-
92
-
93
-
94
-
95
-
96
-
97
-
98
-
99
-
100
-
101
-
102
-
103
-
104
-
105
-
106
-
107
-
108
-
109
-
110
-
111
-
112
-
113
-
114
-
115
-
116
-
117
-
118
-
119
-
120
-
121
-
122
-
123
-
124
-
125
-
126
-
127
-
128
-
129
-
130
-
131
-
132
-
133
-
134
-
135
-
136
-
137
-
138
-
139
-
140
-
141
-
142
-
143
-
144
-
145
-
146
-
147
-
148
-
149
-
150
-
151
-
152
-
153
-
154
-
155
-
156
-
157
-
158
-
159
-
160
-
161
-
162
-
163
-
164
-
165
-
166
-
167
-
168
-
169
-
170
-
171
-
172
-
173
-
174
-
175
-
176
-
177
-
178
-
179
-
180
-
181
-
182
-
183
-
184
-
185
-
186
-
187
-
188
-
189
-
190
-
191
-
192
-
193
-
194
-
195
-
196
-
197
-
198
-
199
-
200
-
201
-
202
-
203
-
204
-
205
-
206
-
207
-
208
-
209
-
210
-
211
-
212
-
213
-
214
-
215
-
216
-
217
-
218
-
219
-
220
-
221
-
222
-
223
-
224
-
225
-
226
-
227
-
228
-
229
-
230
-
231
-
232
-
233
-
234
-
235
-
236
-
237
-
238
-
239
-
240
-
241
-
242
-
243
-
244
 |
 |

2009 REGISTRATION DOCUMENT SCHNEIDER ELECTRIC46
SUSTAINABLE DEVELOPMENT
2ENVIRONMENTAL PERFORMANCE
Ambition and objectives
As part of the One company programme , Schneider Electric has
reaffi rmed its ambition to:
•reduce its carbon footprint;
preserve health and biodiversity;
•use fewer natural resources.
In line with these ambitions, three priority objectives have been
included in the Planet & Society Barometer for the duration of
the One company programme (2009-2011):
1.
30,000T annual Reduction of our CO
2
emissions;
2.
2/3 of our products’ revenues gained with green premium
products;
3.
2/3 of our employees work in ISO 14001 certifi ed sites.
These ambitions and objectives provide the framework for Schneider
Electric’s eco-design and eco-production programmes .
In addition, the Group has taken measures to continuously raise the
environmental awareness of its team members and partners. It also
contributes signifi cantly to the defi nition of new regulations and their
early adoption.
Training and informing employees is a key mission for country and
unit environmental managers .
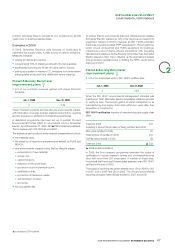
Planet & Society Barometer
improvementplans
•30,000T annual Reduction of our CO2 emissions
Jan. 1, 2009 Dec. 31, 2009
3 6,43
Climate change is one of the major challenges of our time. Schneider
Electric is committed to reducing greenhouse gas emissions from
its own businesses and from its clients’ operations, notably with its
solutions to enhance energy effi ciency.
Schneider Electric reports publicly on its approach by providing
measurements each year to the Carbon Disclosure Project (CDP), a
global initiative launched by investors and asset managers. The CDP
is designed to help members make informed investment decisions
by explaining the consequences of the carbon constraint and climate
change for companies.
Schneider Electric has been a member of the Clinton Climate Initiative
since August2007. This global initiative was launched to fi ght global
warming through improved energy effi ciency and other measures.
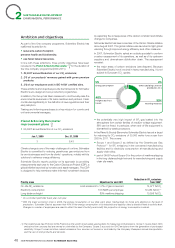
In 2007, Schneider Electric asked an outside specialist to perform
a carbon assessment of its operations, as well as of its upstream
suppliers and downstream distribution chain. The assessment
revealed:
•the major areas of carbon emissions (see diagram). Because
Schneider Electric in not involved in heavy manufacturing, it is not
subject to European CO2 quotas;
5%
Energy consumption
40%
Freight & business
travels 53%
Incoming materials
2%
Others (buildings, internal
procedures, etc.)
•the potentially very high impact of SF6 gas leaked into the
atmosphere from certain families of medium voltage equipment.
SF6 can be freed, in particular, when end-of-life equipment is
dismantled by waste processors.
In the Planet & Society Barometer, Schneider Electric has set a target
for reducing its CO2 emissions of 30,000 metric tons a year from
2009 to 2011. This covers:
•Scope 1 and Scope 2 as defined by the Greenhouse Gas
Protocol
(1) for SF6 emissions in the concerned manufacturing
facilities and for electricity consumption at manufacturing and
supply chain sites;
•part of GHG Protocol Scope 3 for the portion of maritime shipping
in the long-distance freight mix and for manufacturing and supply
chain site waste.
(1) The Greenhouse Gas Protocol (GHG Protocol) is the world’s most widely used system for measuring CO2 emissions. Scope 1 covers direct GHG
emissions from sources that are owned or controlled by the Company. Scope 2 accounts for GHG emissions from the generation of purchased
electricity. Scope 3 covers all other indirect emissions from sources not owned or controlled by the Company. Examples include transportation
and the use of sold products and services.
Priority areas Objectives for end-2011 Reduction in CO2 emissions
from2008*
On-site SF6 emissions Limit emissions to 1.2% of gas consumed 14, 077 TeCO2
Electricity consumption 13.5 MWh per employee 19, 484 TeCO2 **
Long distance freight 80% maritime shipping 10, 598 TeCO2
* On a constant perimeter basis year over year.
** With the major economic crisis in 2009, the energy consumption of our sites went down mechanically for those who depend on the level of
production. Schneider Electric assumes that 40% of the energy consumption of its industrial and logistics sites is directly linked to activity level.
Changes in number of employees are used to reflect the level of activity and modify the proportion of energy consumption involved.