APC 2009 Annual Report Download - page 73
Download and view the complete annual report
Please find page 73 of the 2009 APC annual report below. You can navigate through the pages in the report by either clicking on the pages listed below, or by using the keyword search tool below to find specific information within the annual report.-
 1
1 -
2
-
3
-
4
-
5
-
6
-
7
-
8
-
9
-
10
-
11
-
12
-
13
-
14
-
15
-
16
-
17
-
18
-
19
-
20
-
21
-
22
-
23
-
24
-
25
-
26
-
27
-
28
-
29
-
30
-
31
-
32
-
33
-
34
-
35
-
36
-
37
-
38
-
39
-
40
-
41
-
42
-
43
-
44
-
45
-
46
-
47
-
48
-
49
-
50
-
51
-
52
-
53
-
54
-
55
-
56
-
57
-
58
-
59
-
60
-
61
-
62
-
 63
63 -
 64
64 -
 65
65 -
 66
66 -
 67
67 -
 68
68 -
 69
69 -
 70
70 -
 71
71 -
 72
72 -
 73
73 -
 74
74 -
 75
75 -
 76
76 -
 77
77 -
 78
78 -
 79
79 -
 80
80 -
 81
81 -
 82
82 -
 83
83 -
84
-
85
-
86
-
87
-
88
-
89
-
90
-
91
-
92
-
93
-
94
-
95
-
96
-
97
-
98
-
99
-
100
-
101
-
102
-
103
-
104
-
105
-
106
-
107
-
108
-
109
-
110
-
111
-
112
-
113
-
114
-
115
-
116
-
117
-
118
-
119
-
120
-
121
-
122
-
123
-
124
-
125
-
126
-
127
-
128
-
129
-
130
-
131
-
132
-
133
-
134
-
135
-
136
-
137
-
138
-
139
-
140
-
141
-
142
-
143
-
144
-
145
-
146
-
147
-
148
-
149
-
150
-
151
-
152
-
153
-
154
-
155
-
156
-
157
-
158
-
159
-
160
-
161
-
162
-
163
-
164
-
165
-
166
-
167
-
168
-
169
-
170
-
171
-
172
-
173
-
174
-
175
-
176
-
177
-
178
-
179
-
180
-
181
-
182
-
183
-
184
-
185
-
186
-
187
-
188
-
189
-
190
-
191
-
192
-
193
-
194
-
195
-
196
-
197
-
198
-
199
-
200
-
201
-
202
-
203
-
204
-
205
-
206
-
207
-
208
-
209
-
210
-
211
-
212
-
213
-
214
-
215
-
216
-
217
-
218
-
219
-
220
-
221
-
222
-
223
-
224
-
225
-
226
-
227
-
228
-
229
-
230
-
231
-
232
-
233
-
234
-
235
-
236
-
237
-
238
-
239
-
240
-
241
-
242
-
243
-
244
 |
 |

2009 REGISTRATION DOCUMENT SCHNEIDER ELECTRIC 71
SUSTAINABLE DEVELOPMENT
2
METHODOLOGY
>
8. Methodology
Methodology underlying Planet & Society
Barometer indicators and human resources,
safety and environmental data
Frame of reference
In the absence of any recognised and meaningful benchmark for
companies involved in manufacturing and assembling electronic
components, Schneider Electric has drawn up a frame of reference
with reporting methods for the Planet & Society Barometer’s
indicators and for human resources, safety and environment data.
This frame of reference provides definitions, describes the
scope of reporting and explains procedures for collecting and
consolidating data. As part of its continuous improvement process,
SchneiderElectric is gradually adapting the sustainable development
indicators as the Group evolves. The frame of reference is regularly
updated and may be accessed at www.barometer .schneider-electric.
com.
Scope
Planet & Society Barometer
The Planet & Society Barometer indicators are based on specifi c
data and on human resources, safety and environmental data. They
cover all Group units and global functions.
Human resources, safety and environmental
data
Human resources and safety data are consolidated at the worldwide
level for all companies that are fully consolidated in the Group’s
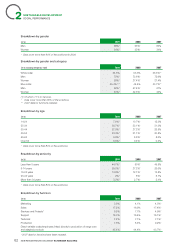
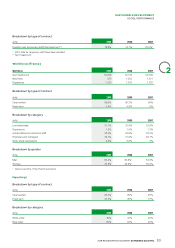
fi nancial statements. Workforce data concerning the breakdown by
gender, gender and category, age, seniority, function and type of
contract cover 80 % of the total workforce.
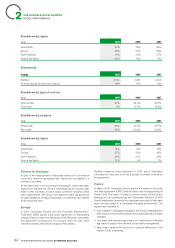
All ISO 14001-compliaint units must report environmental data. All
production and supply chain sites with 50 or more employees must
obtain ISO 14001 certifi cation before the end of the third full calendar
year of operation or membership in the Group. Administrative, R&D
and sales sites with 300 employees or more must obtain ISO 14001
certifi cation by the end of 2011. Other sites may seek certifi cation
and/or report on a voluntary basis.
Units belonging to fully consolidated companies are included on a
100% basis, as are units belonging to proportionally consolidated
companies. Companies accounted for by the equity method are not
included in the reporting.
Data collection and consolidation
In keeping with its commitment to continuous improvement,
Schneider Electric asked Ernst & Young to conduct a review in order
to obtain a moderate level of assurance for certain human resources,
safety and environment indicators.
Planet & Society Barometer
The Planet & Society Barometer indicators use the following data
concerning human resources, safety and the environment: total
workforce, average workforce at production sites, lost time injury
frequency rate, energy consumption, CO2 emissions, percentage
of ISO 14001-certifi ed sites, number of products with a Product
Environmental Profile (PEP) and percentage of total purchases
sourced from suppliers who have signed the Global Compact or
equivalent. This data is reviewed by Ernst & Young.
Departments directly concerned by specifi c indicators, such as
Human Resources, Environmental Affairs and the Schneider Electric
Foundation, are responsible for using and consolidating other data.
Each department is represented by a project manager.
The Group’s Sustainable Development Department calculates the
Planet & Society Barometer’s overall performance.
Human resources, safety and environmental
data
Human resources, safety and environmental data are drawn from
several dedicated reporting sources available on the Group’s intranet.
Depending on their nature, the data are consolidated by the Human
Resources or the Global Supply Chain Departments. Data are
checked during consolidation, with a review of changes from the
previous year and inter-site comparisons. No estimates are used to
replace inconsistent or missing data.