APC 2009 Annual Report Download - page 37
Download and view the complete annual report
Please find page 37 of the 2009 APC annual report below. You can navigate through the pages in the report by either clicking on the pages listed below, or by using the keyword search tool below to find specific information within the annual report.-
 1
1 -
2
-
3
-
4
-
5
-
6
-
7
-
8
-
9
-
10
-
11
-
12
-
13
-
14
-
15
-
16
-
17
-
18
-
19
-
20
-
21
-
22
-
23
-
24
-
25
-
26
-
 27
27 -
 28
28 -
 29
29 -
 30
30 -
 31
31 -
 32
32 -
 33
33 -
 34
34 -
 35
35 -
 36
36 -
 37
37 -
 38
38 -
 39
39 -
 40
40 -
 41
41 -
 42
42 -
 43
43 -
 44
44 -
 45
45 -
 46
46 -
 47
47 -
48
-
49
-
50
-
51
-
52
-
53
-
54
-
55
-
56
-
57
-
58
-
59
-
60
-
61
-
62
-
63
-
64
-
65
-
66
-
67
-
68
-
69
-
70
-
71
-
72
-
73
-
74
-
75
-
76
-
77
-
78
-
79
-
80
-
81
-
82
-
83
-
84
-
85
-
86
-
87
-
88
-
89
-
90
-
91
-
92
-
93
-
94
-
95
-
96
-
97
-
98
-
99
-
100
-
101
-
102
-
103
-
104
-
105
-
106
-
107
-
108
-
109
-
110
-
111
-
112
-
113
-
114
-
115
-
116
-
117
-
118
-
119
-
120
-
121
-
122
-
123
-
124
-
125
-
126
-
127
-
128
-
129
-
130
-
131
-
132
-
133
-
134
-
135
-
136
-
137
-
138
-
139
-
140
-
141
-
142
-
143
-
144
-
145
-
146
-
147
-
148
-
149
-
150
-
151
-
152
-
153
-
154
-
155
-
156
-
157
-
158
-
159
-
160
-
161
-
162
-
163
-
164
-
165
-
166
-
167
-
168
-
169
-
170
-
171
-
172
-
173
-
174
-
175
-
176
-
177
-
178
-
179
-
180
-
181
-
182
-
183
-
184
-
185
-
186
-
187
-
188
-
189
-
190
-
191
-
192
-
193
-
194
-
195
-
196
-
197
-
198
-
199
-
200
-
201
-
202
-
203
-
204
-
205
-
206
-
207
-
208
-
209
-
210
-
211
-
212
-
213
-
214
-
215
-
216
-
217
-
218
-
219
-
220
-
221
-
222
-
223
-
224
-
225
-
226
-
227
-
228
-
229
-
230
-
231
-
232
-
233
-
234
-
235
-
236
-
237
-
238
-
239
-
240
-
241
-
242
-
243
-
244
 |
 |

2009 REGISTRATION DOCUMENT SCHNEIDER ELECTRIC 35
DESCRIPTION OFTHEGROUP, ITSMARKETS ANDITSBUSINESSES
1
RISK FACTORS
Property damage and business interruption
insurance
This global property damage and business interruption insurance
programme was renewed for a two-year period on July 1, 2008. An
“all risks except” contract wich covers fi re, explosion, natural disaster,
machinery breakdown and other events that could affect Schneider
Electric’s property, as well as operating losses caused by business
interruption. Settlements under the global programme are capped
at EUR 350million per claim and specifi c limits apply to certain risks,
such as natural disasters and machinery breakdown . These limits
were determined on the basis of scenarios of loss established by
specialists and available capacity in the insurance market.
Assets are insured at replacement value. Specialized engineers from
the programme ’s main insurance companies visit the Group’s largest
sites.
Shipping and transport insurance
On January 1, 2009, the Group implemented a new global shipping/
transport insurance programme that covers all goods shipments,
including between Group facilities, by all means of transport, with
a maximum insured value of EUR 15.2million per convoy. The two-
year programme covers Group subsidiaries that had previously been
insured under local, non-integrated contracts.
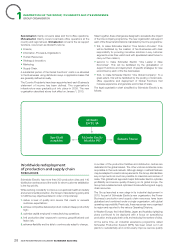
Self insurance
To optimise costs, Schneider Electric self insures certain frequent
risks through two captive insurance companies:
•outside North America, a captive reinsurance company offers
property/casualty and liability coverage capped at EUR 11million
per year;
•in North America, a captive reinsurance company is used to
align deductibles and self-insured retentions imposed by the
insurers of automobile, liability and workers’ compensation
primary layers . Self-insured retentions range from USD 0.5million
to USD 5 million per claim, depending on the risk. An actuary
validates the provisions recorded by the captive reinsurance
company each year.
The cost of self-insured claims is not material at the Group level.
Cost of insurance programmes
The cost of the Group’s main insurance programmes totalled around
EUR 15million in 2009.