APC 2009 Annual Report Download - page 56
Download and view the complete annual report
Please find page 56 of the 2009 APC annual report below. You can navigate through the pages in the report by either clicking on the pages listed below, or by using the keyword search tool below to find specific information within the annual report.-
 1
1 -
2
-
3
-
4
-
5
-
6
-
7
-
8
-
9
-
10
-
11
-
12
-
13
-
14
-
15
-
16
-
17
-
18
-
19
-
20
-
21
-
22
-
23
-
24
-
25
-
26
-
27
-
28
-
29
-
30
-
31
-
32
-
33
-
34
-
35
-
36
-
37
-
38
-
39
-
40
-
41
-
42
-
43
-
44
-
45
-
 46
46 -
 47
47 -
 48
48 -
 49
49 -
 50
50 -
 51
51 -
 52
52 -
 53
53 -
 54
54 -
 55
55 -
 56
56 -
 57
57 -
 58
58 -
 59
59 -
 60
60 -
 61
61 -
 62
62 -
 63
63 -
 64
64 -
 65
65 -
 66
66 -
67
-
68
-
69
-
70
-
71
-
72
-
73
-
74
-
75
-
76
-
77
-
78
-
79
-
80
-
81
-
82
-
83
-
84
-
85
-
86
-
87
-
88
-
89
-
90
-
91
-
92
-
93
-
94
-
95
-
96
-
97
-
98
-
99
-
100
-
101
-
102
-
103
-
104
-
105
-
106
-
107
-
108
-
109
-
110
-
111
-
112
-
113
-
114
-
115
-
116
-
117
-
118
-
119
-
120
-
121
-
122
-
123
-
124
-
125
-
126
-
127
-
128
-
129
-
130
-
131
-
132
-
133
-
134
-
135
-
136
-
137
-
138
-
139
-
140
-
141
-
142
-
143
-
144
-
145
-
146
-
147
-
148
-
149
-
150
-
151
-
152
-
153
-
154
-
155
-
156
-
157
-
158
-
159
-
160
-
161
-
162
-
163
-
164
-
165
-
166
-
167
-
168
-
169
-
170
-
171
-
172
-
173
-
174
-
175
-
176
-
177
-
178
-
179
-
180
-
181
-
182
-
183
-
184
-
185
-
186
-
187
-
188
-
189
-
190
-
191
-
192
-
193
-
194
-
195
-
196
-
197
-
198
-
199
-
200
-
201
-
202
-
203
-
204
-
205
-
206
-
207
-
208
-
209
-
210
-
211
-
212
-
213
-
214
-
215
-
216
-
217
-
218
-
219
-
220
-
221
-
222
-
223
-
224
-
225
-
226
-
227
-
228
-
229
-
230
-
231
-
232
-
233
-
234
-
235
-
236
-
237
-
238
-
239
-
240
-
241
-
242
-
243
-
244
 |
 |

2009 REGISTRATION DOCUMENT SCHNEIDER ELECTRIC54
SUSTAINABLE DEVELOPMENT
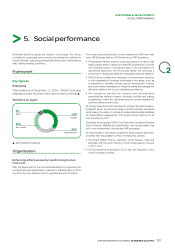
2SOCIAL PERFORMANCE
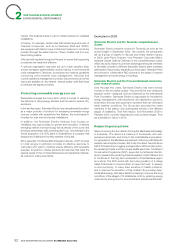
This transformation naturally gives both managers and non-
managers more autonomy to manage their careers, thereby
putting team members in a position to drive their own career
development.
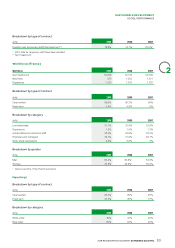
The HR function should achieve substantial productivity gains
exceeding 25% over three years. In 2009 alone, the function’s costs
declined by more than 15%.
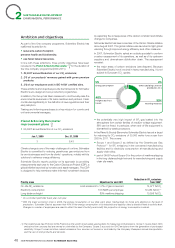
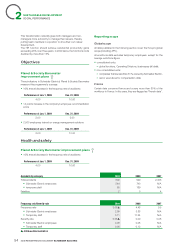
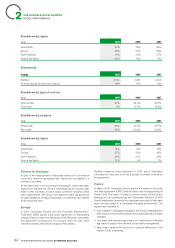
Objectives
Planet & Society Barometer
improvementplans
Three indicators in Schneider Electric’s Planet & Society Barometer
measure this programme ’s success:
•10% annual decrease in the frequency rate of accidents
Performance at Jan. 1, 2009 Dec. 31, 2009
4.00 10.00
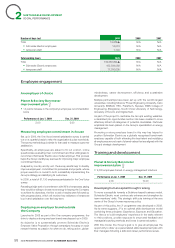
•14 points increase in the company’s employee recommendation
score
Performance at Jan. 1, 2009 Dec. 31, 2009
2.00 2.00
• 2,000 employees trained on energy management solutions
Performance at Jan. 1, 2009 Dec. 31, 2009
2.00 10.00
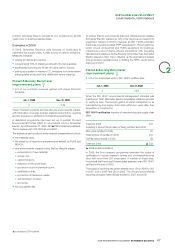
Reporting scope
Global scope
All data published in the following section cover the Group’s global
scope (including APC).
All workforce data excludes temporary employees, except for the
average workforce fi gure:
•consolidated units:
–global functions, Operating Divisions, businesses (all data);
•non-consolidated units:
–companies that are less than 51%-owned by Schneider Electric,
–senior executives for compensation data.
France
Certain data concerns France and covers more than 80% of the
workforce in France. In this case, they are fl agged as “French data”.
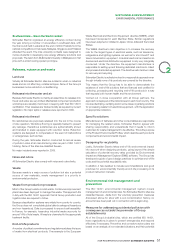
Health and safety
Planet & Society Barometer improvementplans
•10% annual decrease in the frequency rate of accidents
Performance at Jan. 1, 2009 Dec. 31, 2009
4.00 10.00
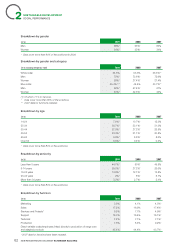
Accidents by category 2009 2008 2007
Total accidents 609 929 2,335
• Schneider Electric employees 544 740 N/A
• temporary staff 65 189 N/A
Fatalities 204
Frequency rate/Severity rate 2009 2008 2007
Frequency rate 3.06▲4.48 9.5
•Schneider Electric employees 2.99 3.88 N/A
•Temporary staff 3.11 11.24 N/A
Severity rate 0.08▲0.09 0.08
•Schneider Electric employees 0.08 0.08 N/A
•Temporary staff 0.08 0.12 N/A
▲ 2009 audited indicators▲ 2009 audited indicators