APC 2009 Annual Report Download - page 114
Download and view the complete annual report
Please find page 114 of the 2009 APC annual report below. You can navigate through the pages in the report by either clicking on the pages listed below, or by using the keyword search tool below to find specific information within the annual report.-
 1
1 -
2
-
3
-
4
-
5
-
6
-
7
-
8
-
9
-
10
-
11
-
12
-
13
-
14
-
15
-
16
-
17
-
18
-
19
-
20
-
21
-
22
-
23
-
24
-
25
-
26
-
27
-
28
-
29
-
30
-
31
-
32
-
33
-
34
-
35
-
36
-
37
-
38
-
39
-
40
-
41
-
42
-
43
-
44
-
45
-
46
-
47
-
48
-
49
-
50
-
51
-
52
-
53
-
54
-
55
-
56
-
57
-
58
-
59
-
60
-
61
-
62
-
63
-
64
-
65
-
66
-
67
-
68
-
69
-
70
-
71
-
72
-
73
-
74
-
75
-
76
-
77
-
78
-
79
-
80
-
81
-
82
-
83
-
84
-
85
-
86
-
87
-
88
-
89
-
90
-
91
-
92
-
93
-
94
-
95
-
96
-
97
-
98
-
99
-
100
-
101
-
102
-
103
-
 104
104 -
 105
105 -
 106
106 -
 107
107 -
 108
108 -
 109
109 -
 110
110 -
 111
111 -
 112
112 -
 113
113 -
 114
114 -
 115
115 -
 116
116 -
 117
117 -
 118
118 -
 119
119 -
 120
120 -
 121
121 -
 122
122 -
 123
123 -
 124
124 -
125
-
126
-
127
-
128
-
129
-
130
-
131
-
132
-
133
-
134
-
135
-
136
-
137
-
138
-
139
-
140
-
141
-
142
-
143
-
144
-
145
-
146
-
147
-
148
-
149
-
150
-
151
-
152
-
153
-
154
-
155
-
156
-
157
-
158
-
159
-
160
-
161
-
162
-
163
-
164
-
165
-
166
-
167
-
168
-
169
-
170
-
171
-
172
-
173
-
174
-
175
-
176
-
177
-
178
-
179
-
180
-
181
-
182
-
183
-
184
-
185
-
186
-
187
-
188
-
189
-
190
-
191
-
192
-
193
-
194
-
195
-
196
-
197
-
198
-
199
-
200
-
201
-
202
-
203
-
204
-
205
-
206
-
207
-
208
-
209
-
210
-
211
-
212
-
213
-
214
-
215
-
216
-
217
-
218
-
219
-
220
-
221
-
222
-
223
-
224
-
225
-
226
-
227
-
228
-
229
-
230
-
231
-
232
-
233
-
234
-
235
-
236
-
237
-
238
-
239
-
240
-
241
-
242
-
243
-
244
 |
 |

2009 REGISTRATION DOCUMENT SCHNEIDER ELECTRIC112
BUSINESS REVIEW
4REVIEW OF SUBSIDIARIES
>
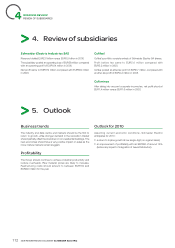
4. Review of subsidiaries
Schneider Electric Industries SAS
Revenue totalled EUR 2.8billion versus EUR 3.5billion in 2008.
The subsidiary posted an operating loss of EUR 58million compared
with an operating profi t of EUR 124million in 2008.
Net profi t came to EUR 672million compared with EUR 550million
in 2008.
Cofibel
Cofi bel’s portfolio consists entirely of Schneider Electric SA shares.
Profit before tax came to EUR 5.6 million compared with
EUR 5.2million in 2008.
Cofi bel posted an after-tax profi t of EUR 6.7million, compared with
an after-tax profi t of EUR 5.2million in 2008.
Cofimines
After taking into account corporate income tax, net profi t stood at
EUR 1.4million versus EUR 1.6million in 2008.
>
5. Outlook
Business trends
The industry and data centre end markets should be the fi rst to
return to growth, while stronger demand in the renovation market
should partially offset the slowdown in non-residential buildings. The
new economies should have a very positive impact on sales as the
more mature markets remain sluggish.
Profitability
The Group should continue to achieve industrial productivity and
reduce overhead s. Raw material prices are likely to increase.
Restructuring costs should amount to between EUR 150 and
EUR 200million for the year.
Outlook for 2010
Assuming current economic conditions, Schneider Electric
anticipates for 2010 :
•a return to topline growth at low single-digit (on organic basis);
•an improvement of profi tability with an EBITAR of around 14%
( before any impact of integration of Areva Distribution ).